第五章 目标检测中K-means聚类生成Anchor box(工具)
第一种做法
在基于anchor的目标检测算法中,anchor一般都是通过人工设计的。例如,在SSD、Faster-RCNN中,设计了9个不同大小和宽高比的anchor。然而,通过人工设计的anchor存在一个弊端,就是并不能保证它们一定能很好的适合数据集,如果anchor的尺寸和目标的尺寸差异较大,则会影响模型的检测效果。
在论文YOLOv2中提到了这个问题,作者建议使用K-means聚类来代替人工设计,通过对训练集的bounding box进行聚类,自动生成一组更加适合数据集的anchor,可以使网络的检测效果更好。
“The network can learn to adjust the boxes appropriately but if we pick better priors for the network to start with we can make it easier for the network to learn to predict good detections. Instead of choosing priors by hand, we run k-means clustering on the training set bounding boxes to automatically find good priors.”
本文将解释如何使用k-means聚类来生成一组anchor。
Standard K-means
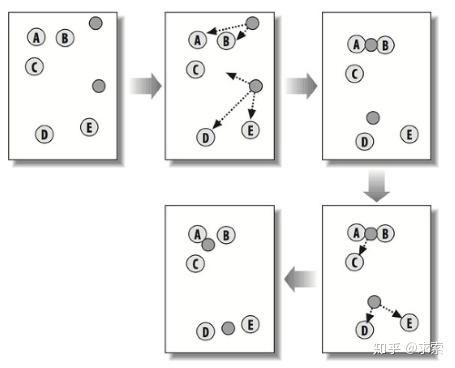
首先简单复习一下标准的K-means算法,K-means是一种简单且常用的无监督学习算法,它旨在将数据集划分成K个簇,使得相同簇之内的数据相似性高,不同簇之间的数据相似性低。
算法步骤:
- 初始化K个簇中心;
- 使用相似性度量(一般是欧氏距离),将每个样本分配给与其距离最近的簇中心;
- 计算每个簇中所有样本的均值,更新簇中心;
- 重复2、3步,直到均簇中心不再变化,或者达到了最大迭代次数。
Anchor K-means
接下来介绍如何对bounding box进行K-means。
度量选择
通常,bounding box由左上角顶点和右下角顶点表示,即 (x1,y1,x2,y2) 。在对box做聚类时,我们只需要box的宽和高作为特征,并且由于数据集中图片的大小可能不同,还需要先使用图片的宽和高对box的宽和高做归一化,即
w=\frac{w_{box}}{w_{img}}, h=\frac{h_{box}}{h_{img}}
如果直接使用标准K-means中的欧氏距离作为度量,则会有个问题,就是在聚类结果中,大box簇会比小box簇产生更大的误差(squared error)。由于我们只关心anchor与box的IOU,不关心的box的大小,因此,使用IOU作为度量更加合适。
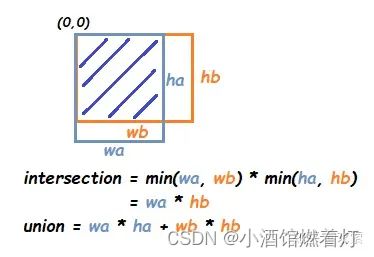
假设有 anchor=(w_{a},h_{a}),box=(w_{b},h_{b}) ,则
IOU(box,anchor)=\frac{intersection(box,anchor)}{union(box,anchor)-intersection(box,anchor)}
=\frac{min(w_{a},w_{b})\cdot min(h_{a},h_{b})}{w_{a}h_{a}+w_{b}h_{b}-min(w_{a},w_{b})\cdot min(h_{a},h_{b})}
需要说明的一点是,这里计算IOU时,不用管box的位置,我们假设所有box的左上顶点都在原点,如下图所示:
显然,IOU的取值在0到1之间,如果两个box越相似,则它们的IOU值越大。由于在习惯上,我们希望两个box越相似则它们的距离应该越近,所以最终的度量公式为:
d(box,anchor)=1-IOU(box,anchor)
由上式可知,当box与anchor完全重叠,即IOU=1时,它们之间的距离为0。
步骤
对box进行K-means的步骤为:
- 随机选取K个box作为初始anchor;
- 使用IOU度量,将每个box分配给与其距离最近的anchor;
- 计算每个簇中所有box宽和高的均值,更新anchor;
- 重复2、3步,直到anchor不再变化,或者达到了最大迭代次数。
与标准K-means的步骤基本一致,主要的不同是第2步中使用的度量是上面定义的 ( , ℎ ) ,这里anchor作为簇的中心。
相关代码
def iou(boxes, anchors):
    """
    Calculate the IOU between boxes and anchors.

    :param boxes: 2-d array, shape(n, 2)
    :param anchors: 2-d array, shape(k, 2)
    :return: 2-d array, shape(n, k)
    """
    # Calculate the intersection,
    # the new dimension are added to construct shape (n, 1) and shape (1, k),
    # so we can get (n, k) shape result by numpy broadcast
    w_min = np.minimum(boxes[:, 0, np.newaxis], anchors[np.newaxis, :, 0])
    h_min = np.minimum(boxes[:, 1, np.newaxis], anchors[np.newaxis, :, 1])
    inter = w_min * h_min

    # Calculate the union
    box_area = boxes[:, 0] * boxes[:, 1]
    anchor_area = anchors[:, 0] * anchors[:, 1]
    union = box_area[:, np.newaxis] + anchor_area[np.newaxis]

    return inter / (union - inter)

def fit(self, boxes):
        """
        Run K-means cluster on input boxes.

        :param boxes: 2-d array, shape(n, 2), form as (w, h)
        :return: None
        """
        # If the current number of iterations is greater than 0, then reset
        if self.n_iter > 0:
            self.n_iter = 0

        np.random.seed(self.random_seed)
        n = boxes.shape[0]

        # Initialize K cluster centers (i.e., K anchors)
        self.anchors_ = boxes[np.random.choice(n, self.k, replace=True)]

        self.labels_ = np.zeros((n,))

        while True:
            self.n_iter += 1

            # If the current number of iterations is greater than max number of iterations , then break
            if self.n_iter > self.max_iter:
                break

            self.ious_ = self.iou(boxes, self.anchors_)
            distances = 1 - self.ious_
            cur_labels = np.argmin(distances, axis=1)

            # If anchors not change any more, then break
            if (cur_labels == self.labels_).all():
                break

            # Update K anchors
            for i in range(self.k):
                self.anchors_[i] = np.mean(boxes[cur_labels == i], axis=0)

            self.labels_ = cur_labels
完整的代码以及下面的demo代码请戳:
Demo
以VOC 2012数据集为例,整个流程可以分三步走:
1. 准备数据
def parse_xml(annot_dir):
    """
    Parse XML annotation files in VOC dataset

    :param annot_dir: directory path to annotation files
    :return: 2-d array
    """
    boxes = []

    for xml_file in glob.glob(os.path.join(annot_dir, '*.xml')):
        tree = ET.parse(xml_file)

        h_img = int(tree.findtext('./size/height'))
        w_img = int(tree.findtext('./size/width'))

        for obj in tree.iter('object'):
            xmin = int(round(float(obj.findtext('bndbox/xmin'))))
            ymin = int(round(float(obj.findtext('bndbox/ymin'))))
            xmax = int(round(float(obj.findtext('bndbox/xmax'))))
            ymax = int(round(float(obj.findtext('bndbox/ymax'))))

            w_norm = (xmax - xmin) / w_img
            h_norm = (ymax - ymin) / h_img

            boxes.append([w_norm, h_norm])

    return np.array(boxes)

annot_dir = "/PATH TO YOUR/VOCdevkit/VOC2012/Annotations"
boxes = parse_xml(annot_dir)
print('boxes shape : {}'.format(boxes.shape))

"""OUTPUT
boxes shape : (40138, 2)
"""
可以看到,VOC2012训练集中总共标注了40138个目标。
2. 选择多个K值进行聚类
使用K-means聚类时,面临的一个重要问题就是如何选择一个合适的K值,也就是我们需要选择几个anchor。考虑到计算复杂度,anchor的数量最好不要超过10,因此通常的做法是:对K在[2,10]这个区间内进行多次聚类,然后画出平均IOU随K值的变化曲线,从中发现最佳的anchor数量。
for k in range(2, 11):
    model = AnchorKmeans(k, random_seed=333)
    model.fit(boxes)
    avg_iou = model.avg_iou()
    print("K = {}, Avg IOU = {:.4f}".format(k, avg_iou))

"""OUTPUT
K = 2, Avg IOU = 0.4646
K = 3, Avg IOU = 0.5391
K = 4, Avg IOU = 0.5801
K = 5, Avg IOU = 0.6016
K = 6, Avg IOU = 0.6252
K = 7, Avg IOU = 0.6434
K = 8, Avg IOU = 0.6596
K = 9, Avg IOU = 0.6732
K = 10, Avg IOU = 0.6838
"""
可以看出,平均IOU随K值的增大而增大,如果K等于box的数量,则平均IOU会等于1。
3. 确定Anchor数量
画出平均IOU随K值的变化曲线,如下:
elbow方法是用来估计最佳K值的常用方法,其思想简单来说就是:如果某个K值使得平均IOU的斜率发生了明显的变化,那么这个K值就是我们想要的。
因此,根据elbow方法,同时考虑更高的召回率,这里我们可以选择K=5作为anchor的数量,这5个anchor分别为:
print(model.anchors_)

"""OUTPUT
[[0.7794355  0.8338808 ]
 [0.33883529 0.68815335]
 [0.61044288 0.40655773]
 [0.19493034 0.35335266]
 [0.07805765 0.13006786]]
"""
可视化:
第二种做法
我们都知道yolov3对训练数据使用了k-means聚类的算法来获得anchor boxes大小,但是具体其计算过程是怎样的呢?下面我们来详细的分析其具体计算过程:
第一步:首先我们要知道我们需要聚类的是bounding box,所以我们无需考虑其所属类别,第一步我们需要将所有的bounding box坐标提取出来,也许一张图有一个矩形框,也许有多个,但是我们需要无区别的将所有图片的所有矩形框提取出来,放在一起。
第二步:数据处理获得所有训练数据bounding boxes的宽高数据。给的训练数据往往是其bounding box的4个坐标,但是我们后续需要聚类分析的是bounding box的宽高大小,所以我们需要将坐标数据转换为框的宽高大小,计算方法很简单:长=右下角横坐标-左上角横坐标、宽=右下角纵坐标-左上角纵坐标。
第三步:初始化k个anchor box,通过在所有的bounding boxes中随机选取k个值作为k个anchor boxes的初始值。
第四步:计算每个bounding box与每个anchor box的iou值。传统的聚类方法是使用欧氏距离来衡量差异,也就是说如果我们运用传统的k-means聚类算法,可以直接聚类bounding box的宽和高,产生k个宽、高组合的anchor boxes,但是作者发现此方法在box尺寸比较大的时候,其误差也更大,所以作者引入了iou值,可以避免这个问题。iou值计算方法:这里参考下图和计算代码:
![]()
min_w_matrix = np.minimum(cluster_w_matrix, box_w_matrix)      #cluster_w_matrix, box_w_matrix分别代表anchor box和bounding box宽大小
min_h_matrix = np.minimum(cluster_h_matrix, box_h_matrix)      #cluster_h_matrix, box_h_matrix分别代表anchor box和bounding box高大小
inter_area = np.multiply(min_w_matrix, min_h_matrix)               #inter_area表示重叠面积
IOU = inter_area / (box_area + cluster_area - inter_area)#box_area表示bounding box面积 ;cluster_area表示anchor box面积
由于iou值往往越大越好,所以作者定义了一个距离d参数,用来表示其误差:
d=1-IOU
第五步:分类操作。经过前一步的计算可以的到每一个bounding box对于每个anchor box的误差d(n,k),我们通过比较每个bounding box其对于每个anchor box的误差大小{d(i,1),d(i,2),…,d(i,k)},选取最小误差的那个anchor box,将这个bounding box分类给它,对于每个bounding box都做这个操作,最后记录下来每个anchor box有哪些bounding box属于它。
第六步:anchor box更新。经过上一步,我们就知道每一个anchor box都有哪些bounding box属于它,然后对于每个anchor box中的那些bounding box,我们再求这些bounding box的宽高中值大小(这里参照github上作者qqwweee那个yolov3项目,也许也有使用平均值进行更新),将其作为该anchor box新的尺寸。
第七步:重复操作第四步到第六步,直到在第五步中发现对于全部bounding box其所属的anchor box类与之前所属的anchor box类完全一样。(这里表示所有bounding box的分类已经不再更新)
第八步:计算anchor boxes精确度。至第七步,其实已经通过k-means算法计算出anchor box。但是细心的同学可能已经发现,k-means.py还给出其精确度大小,其计算方法如下:使用最后得到的anchor boxes与每个bounding box计算其IOU值,对于每个bounding box选取其最高的那个IOU值(代表其属于某一个anchor box类),然后求所有bounding box该IOU值的平均值也即最后的精确度值。
应网友要求附上代码(代码来源):
import numpy as np
import xml.etree.ElementTree as ET
import glob
import random

def cas_iou(box,cluster):
    x = np.minimum(cluster[:,0],box[0])
    y = np.minimum(cluster[:,1],box[1])

    intersection = x * y
    area1 = box[0] * box[1]

    area2 = cluster[:,0] * cluster[:,1]
    iou = intersection / (area1 + area2 -intersection)

    return iou

def avg_iou(box,cluster):
    return np.mean([np.max(cas_iou(box[i],cluster)) for i in range(box.shape[0])])


def kmeans(box,k):
    # 取出一共有多少框
    row = box.shape[0]

    # 每个框各个点的位置
    distance = np.empty((row,k))

    # 最后的聚类位置
    last_clu = np.zeros((row,))

    np.random.seed()

    # 随机选5个当聚类中心
    cluster = box[np.random.choice(row,k,replace = False)]
    # cluster = random.sample(row, k)
    while True:
        # 计算每一行距离五个点的iou情况。
        for i in range(row):
            distance[i] = 1 - cas_iou(box[i],cluster)

        # 取出最小点
        near = np.argmin(distance,axis=1)

        if (last_clu == near).all():
            break

        # 求每一个类的中位点
        for j in range(k):
            cluster[j] = np.median(
                box[near == j],axis=0)

        last_clu = near

    return cluster

def load_data(path):
    data = []
    # 对于每一个xml都寻找box
    for xml_file in glob.glob('{}/*xml'.format(path)):
        tree = ET.parse(xml_file)
        height = int(tree.findtext('./size/height'))
        width = int(tree.findtext('./size/width'))
        # 对于每一个目标都获得它的宽高
        for obj in tree.iter('object'):
            xmin = int(float(obj.findtext('bndbox/xmin'))) / width
            ymin = int(float(obj.findtext('bndbox/ymin'))) / height
            xmax = int(float(obj.findtext('bndbox/xmax'))) / width
            ymax = int(float(obj.findtext('bndbox/ymax'))) / height

            xmin = np.float64(xmin)
            ymin = np.float64(ymin)
            xmax = np.float64(xmax)
            ymax = np.float64(ymax)
            # 得到宽高
            data.append([xmax-xmin,ymax-ymin])
    return np.array(data)


if __name__ == '__main__':
    # 运行该程序会计算'./VOCdevkit/VOC2007/Annotations'的xml
    # 会生成yolo_anchors.txt
    SIZE = 416
    anchors_num = 6
    # 载入数据集,可以使用VOC的xml
    path = r'./VOCdevkit/VOC2007/Annotations'

    # 载入所有的xml
    # 存储格式为转化为比例后的width,height
    data = load_data(path)

    # 使用k聚类算法
    out = kmeans(data,anchors_num)
    out = out[np.argsort(out[:,0])]
    print('acc:{:.2f}%'.format(avg_iou(data,out) * 100))
    print(out*SIZE)
    data = out*SIZE
    f = open("yolo_anchors.txt", 'w')
    row = np.shape(data)[0]
    for i in range(row):
        if i == 0:
            x_y = "%d,%d" % (data[i][0], data[i][1])
        else:
            x_y = ", %d,%d" % (data[i][0], data[i][1])
        f.write(x_y)
    f.close()


