prometheus+grafana 搭建企业级监控系统(二)micrometer自定义监控spring boot 指定接口指标等指标
前言:
之前我们之前一的文章,我们可以监控各种软件,不如mysql,redis,canal,Kafka等,然后去https://grafana.com/grafana/dashboards 找各种模板显示,网上很多资料
大致流程 就是 各种软件 通过自身或者是exporter对外暴露各种指标接口,prometheus通过http方式定时去拉取数据,最后通过granfana的前端图表展示出来
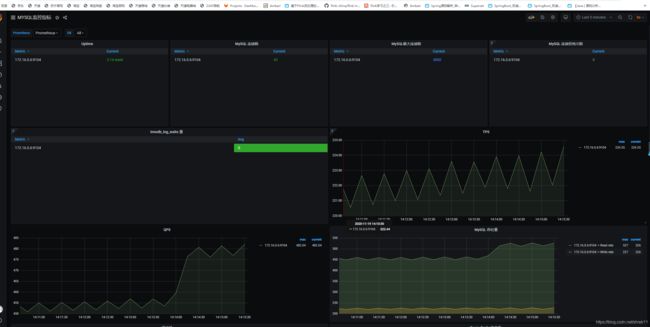
mysql 监控效果图:
redis效果图
canal效果图
上面这些网上很多例子,网上也有,但是我们如果有更细的需求,比如要监控各个接口的数据,成功多少次,失败多少,某段时间的增率,
比如我们要监控spring boot 的各个指标,比如 JVM的内存各个指标,GC,线程数,甚至自己定义的指标,接口调用次数,成功数,失败数,一段时间调用频率等等一些自己定义的指标。
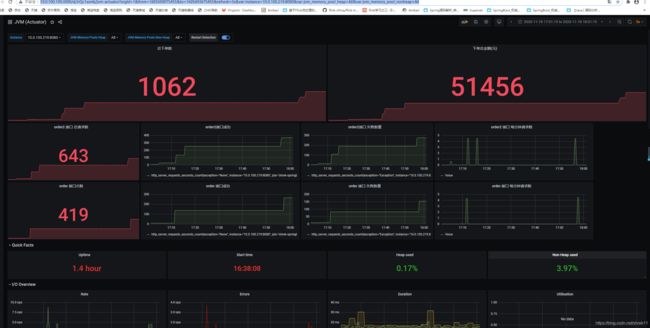
最后效果图如下:
第一步
springboot项目通过 actuator和micrometer定义各种指标,
1,pom文件引入和配置文件放开springboot的默认的指标度量接口
            org.springframework.boot
            spring-boot-starter-actuator


            io.micrometer
            micrometer-registry-prometheus
management:
  security:
    enabled: false
  metrics:
    export:
      prometheus:
        enabled: true
      jmx:
        enabled: true
  endpoints:
    web:
      exposure:
        include: '*'
      base-path: /metrics
2,定义自己的指标项。这里我定义了一个订单次数和订单金额
import io.micrometer.core.instrument.Counter;
import io.micrometer.core.instrument.DistributionSummary;
import io.micrometer.core.instrument.MeterRegistry;
import org.springframework.beans.factory.annotation.Autowired;
import org.springframework.stereotype.Component;

import javax.annotation.PostConstruct;

/**
 * 定义监控的指标
 */

@Component
public class PrometheusCustomMonitor {

    /**
     * 订单发起次数
     */
    private Counter orderCount;

    /**
     * 金额统计
     */
    private DistributionSummary amountSum;

    private final MeterRegistry registry;

    @Autowired
    public PrometheusCustomMonitor(MeterRegistry registry) {
        this.registry = registry;
    }

    @PostConstruct
    private void init() {
        orderCount = registry.counter("order_request_count", "order", "test-svc");
        amountSum = registry.summary("order_amount_sum", "orderAmount", "test-svc");
    }

    public Counter getOrderCount() {
        return orderCount;
    }

    public DistributionSummary getAmountSum() {
        return amountSum;
    }
}
3,在rest接口中,对指标项计数,统计等,另外,我还可以在要统计的一些接口上加@Timed(description = "下单接口") 和@Counted注解
@Slf4j
@RestController
public class OrderController {

    @Resource
    private PrometheusCustomMonitor monitor;

    @PostMapping("order")
    @Timed(description = "下单接口")
    @Counted
    public String order() throws Exception {
        // 统计下单次数
        monitor.getOrderCount().increment();
        Random random = new Random();
        int amount = random.nextInt(100);
        // 统计金额
        monitor.getAmountSum().record(amount);

        int i = random.nextInt(50);
        log.info("请求延迟"+i*10);
//        Thread.sleep(Long.valueOf(i*10));

        if(i*10>300){
            log.error("超过300毫秒错误");
            throw new Exception();
        }

        return "下单成功, 金额: " + amount;
    }

    @PostMapping("order2")
    @Timed(description = "下单接口2")
    @Counted
    public String order2() throws Exception {
        // 统计下单次数
        monitor.getOrderCount().increment();
        Random random = new Random();
        int amount = random.nextInt(100);
        // 统计金额
        monitor.getAmountSum().record(amount);

        int i = random.nextInt(50);
        log.info("请求延迟"+i*10);
//        Thread.sleep(Long.valueOf(i*10));

        if(i*10>300){
            log.error("超过300毫秒错误");
            throw new Exception();
        }

        return "下单成功, 金额: " + amount;
    }
}
4,启动后,我们可以调用这些接口,通过http://localhost:8080/metrics/prometheus 度量接口可以看到
第二步
配置prometheus,修改prometheus.yml,把springboot的节点加上去,重启prometheus,查看targets,看springboot节点是否up
- job_name: 'shrek-springboot'
           # 取一个job 名称来代表被监控的mariadb
    metrics_path: "/metrics/prometheus"
    static_configs:
        - targets: ['10.0.100.219:8080']
第三步
打开Grafana import一个看板,可以用 12856 (你也可以去Granfana的官网找个自己合适的看板),最后出来的图是这样,这里是通用的模板,就是你的一个jvm的一些性能指标参数
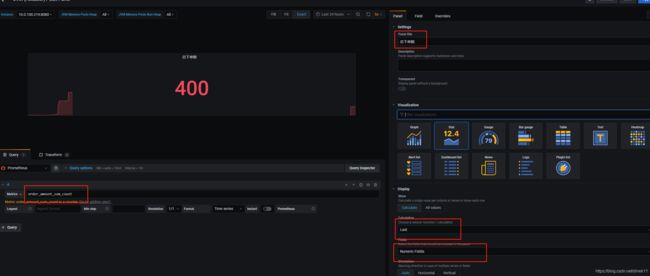
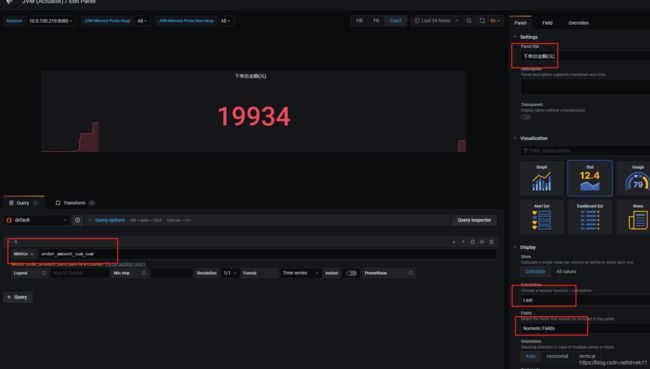
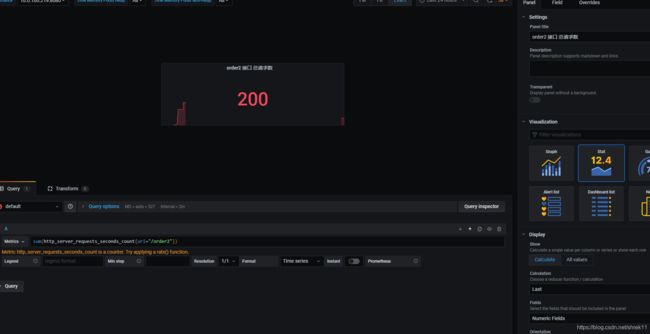
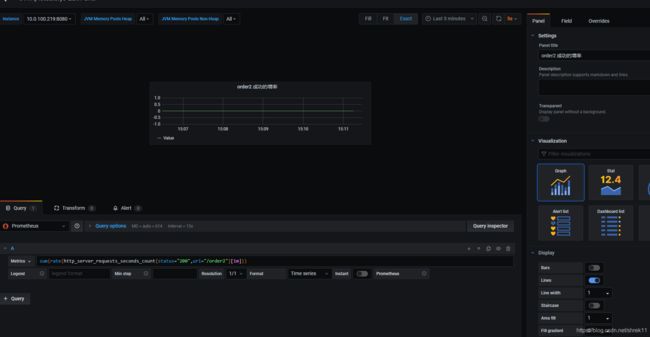
但是你自己的定义的一些指标和接口指标这里没有,这里就需要你自己在这里基础上去增加了,点击右上的加panal,
总下单数
总金额数
order接口总数,成功数,失败数,一段时间接口k线图
最后呈现的效果图如下,我用jmeter分别向2个接口发送200次请求,看看数据和接口k线图
