t检验(连续变量)和卡方检验(分类变量)
目录
情形
不同种类的萼片差异
数据类型查看:
差异分析:
不同萼片的种类差异
数据准备
二分类卡方检验
绘图
情形
:当有两列数据进行分析比较时,一列为连续变量,一列数据为分类变量。
rm(list = ls())
library(ggplot2)
library(ggpubr)
library(cowplot)
data <- iris##鸢尾花数据集
data1 <- data[,c(1,5)]
data2 <- data1[data1$Species=="setosa"|data1$Species=="versicolor",]
##提取鸢尾花数据集的部分数据进行分析
如下整理鸢尾花部分数据:“Sepal.Length”是连续变量,“Species”只选择了两种数据。
分析两列数据:2种情况
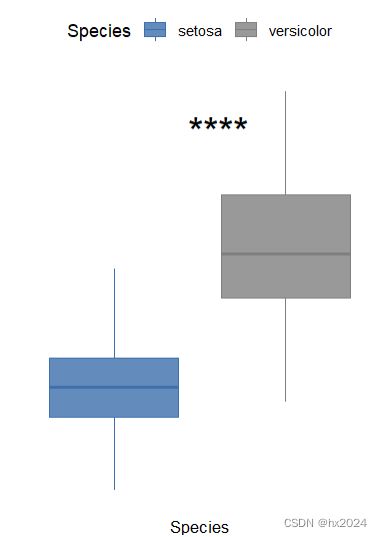
①比较不同种类的萼片长度是否存在差异。
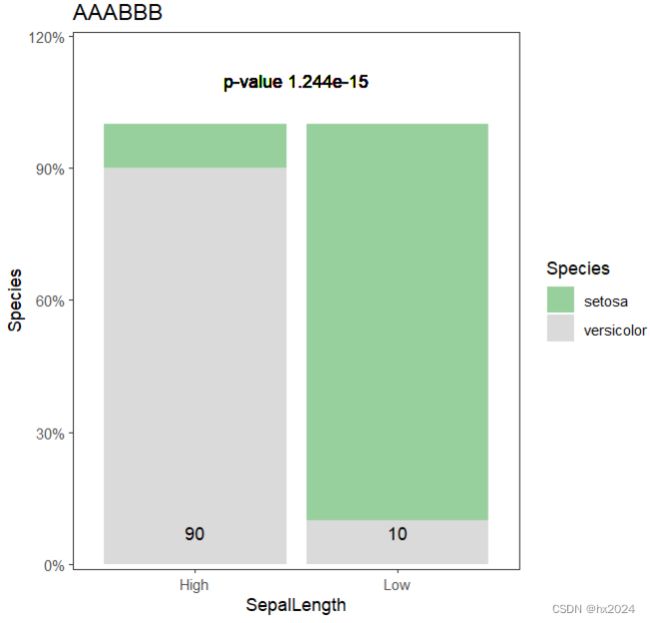
②比较不同萼片长度的种类是否存在差异。
不同种类的萼片差异
数据类型查看:
数据分布检测:第六讲 R-数据正态分布检验 - 知乎 (zhihu.com)
#①比较不同种类的萼片长度是否存在差异。
#分析方法选择
shapiro.test(data2$Sepal.Length)
#W = 0.96964, p-value = 0.02076 不符合正太分布

#密度图
ggdensity(data2$Sepal.Length,
          main = "Density plot of sepal length",
          xlab = "sepal length")
#正态性测试对样本量敏感。小样本最常通过正态性测试。
#因此,重要的是将外观检查和显着性测试相结合以做出正确的决定
#综合分析也可以采用t检验
数据分布情况
差异分析:
#pdf("plot.pdf",width = 4,height = 4)##保存图片
p <- ggplot(na.omit(data2),
             aes(x = Species, y = Sepal.Length, fill = Species)) +
  geom_boxplot(aes(col = Species)) +
  scale_fill_manual(values = alpha(c("#3C6FAC","grey50"),0.8)) +
  scale_color_manual(values = c("#3C6FAC","grey50")) +
  xlab("Species") + ##X轴名称
  ylab("") +
  theme_bw() +
  #主题设置
  theme(legend.position = "top",#添加图例
        #legend.title = "Species",
        #legend.key.size = unit(0.5, "cm"),#缩小图例大小
        axis.text.x = element_blank(),
        axis.text.y = element_blank(),
        axis.ticks = element_blank(),
        panel.border = element_blank(),
        panel.grid = element_blank(),
        panel.background = element_blank(),
        axis.title = element_text(size = 10),
        axis.text = element_text(size = 10)) +
  stat_compare_means(method = "t.test", #wilcox.test(检验方法选择)
                     label = "p.signif",#展示星标**
                     label.y = max(na.omit(data2$Sepal.Length)) * 0.95,
                     label.x = 1.5, size = 8)
p
不同萼片的种类差异
将萼片长度分为二分类变量(如:长短),然后分析不同萼片组的种类是否存在差异
数据准备
##数据准备
rm(list = ls())
library(ggplot2)
library(ggpubr)
library(cowplot)
data <- iris##鸢尾花数据集
data1 <- data[,c(1,5)]
data2 <- data1[data1$Species=="setosa"|data1$Species=="versicolor",]

#②不同萼片长度的种类是否存在差异
data3 <- data2[order(data2$Sepal.Length),]
#计算分割点(进行二分类设置)
point <- round(nrow(data3) / 2)##几分之几,自己设置
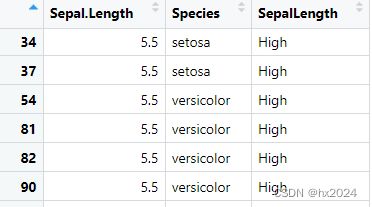
data3$SepalLength[1:point] <-"Low"
data3$SepalLength[point:nrow(data3)] <-"High"

#详情
table(data3$Species,data3$SepalLength)
             High Low
setosa        6  44
versicolor   45   5
virginica     0   0
二分类卡方检验
R语言卡方检验最全总结_医学和生信笔记的博客-CSDN博客
R语言—卡方检验 - 知乎 (zhihu.com)
R=C=2时四格表卡方检验
当 n(样本量)≥40 且所有的T(期望频数)≥5时,用χ2检验的基本公式或四格表资料之χ2检验的专用公式;当P ≈ α时,改用四格表资料的 Fisher 确切概率法;
当 n≥40 但有 1≤T<5 时,用四格表资料χ2检验的校正公式,或改用四格表资料的 Fisher 确切概率法。
当 n<40,或 T<1时,用四格表资料的 Fisher 确切概率法。
#生成二维列联表
mytable <- table(data3$Species,data3$SepalLength)
mytable1 <-mytable[c(1,2),]##需要去除列联表中并没有的第三列(否则不能计算)
chisq.test(mytable1,correct = F) # 和SPSS一样
#结果:X-squared = 64, df = 1, p-value = 1.244e-15
#data3$Species,data3$SepalLength顺序不影响结果
绘图
比例计算
##绘制堆砌图并展示结果
#表格汇总结果(为了展示比例)
result <- data3 %>%
  group_by(Species, SepalLength) %>%
  summarize(count = n()) %>%
  mutate(proportion = count / sum(count))
print(result)# 输出结果
result <- as.data.frame(result)
result$proportion <- round(result$proportion*100,1)#保留1位小数
dat01 <- result[c(3,4),]#提取需要展示的数值的行(需要匹配X轴)
完整图
#pdf("plot.pdf",width = 4,height = 4)##保存图片
ggplot(data3,aes(x=SepalLength,#X轴
                     fill=Species))+
  geom_bar(position = "fill")+
  scale_y_continuous(expand = expansion(mult=c(0.01,0.1)),##展示百分比
                     labels = scales::percent_format())+
  scale_fill_manual(values = c("setosa"="#98d09d","versicolor"="#dadada"),##根据需求修改配色
                    limits=c("setosa","versicolor"))+
  theme_set(theme_bw())+
  theme(panel.grid = element_blank())+#不展示网格线
  geom_text(data=dat01,##展示比例
            aes(x=SepalLength,y=0.05,#设置Y轴展示的位置
                label=paste0(dat01$proportion)),##展示的是比例
            inherit.aes = FALSE,
            vjust=-0.2)+
  geom_text(aes(x = 1.5, y = 1.1,#调整文本注释位置
                label = "p-value 1.244e-15"))+#添加P(前面计算)
  labs(title = "AAABBB",#标题
       x="SepalLength",
       y="Species")
dev.off()
更多绘图细节
ggplot2作图最全教程(上) - 知乎 (zhihu.com)
ggplot2作图最全教程(下) - 知乎 (zhihu.com)


