天猫用户重复购买预测——数据探索
天猫用户重复购买预测——数据探索
- 1. 理论
-
- 1.1 缺失数据处理
- 1.2 不均衡样本
- 1.2.1 随机欠采样
- 1.2.2 随机过采样
- 1.2.3 基于聚类的过采样方法
- 1.2.4 SMOTE算法
- 1.2.5 基于数据清洗的SMOTE
- 1.3 数据分布
- 2. 实战数据探索
-
- 2.1 环境Google colab
- 2.2 导入工具包
- 2.3 读取数据
- 2.4 数据集样例查看
- 2.5 查看数据类型和数据大小
- 2.6 查看缺失值
- 2.7 观察数据分布
-
- 2.7.1 查看整体数据统计
- 2.7.2 查看正负样本的分布,并可视化
- 2.8 探查影响复购的各种影响因素
-
- 2.8.1 店铺分析
- 2.8.2 用户分析
- 2.8.3 用户性别分析
- 2.8.4 用户年龄分析
1. 理论
1.1 缺失数据处理
1.2 不均衡样本
1.2.1 随机欠采样
随机欠采样的优点是在平衡数据的同时减小了数据量,加速了训练;
缺点是数据减少会影响模型的特征学习能力和泛化能力。
1.2.2 随机过采样
随机过采样的优点是相对于欠采样,其没有导致数据信息的损失;
缺点是对较少类别的复制增加了过拟合的可能性。
一般而言,采用以上简单方法通常可以解决绝大多数样本分布不均匀的问题。
1.2.3 基于聚类的过采样方法
1.2.4 SMOTE算法
1.2.5 基于数据清洗的SMOTE
1.3 数据分布
-
伯努利分布
-
二项分布
-
泊松分布
-
正态分布
-
指数分布
2. 实战数据探索
2.1 环境Google colab
from google.colab import drive
drive.mount('/content/drive')
%cd /content/drive/My Drive
!ls
2.2 导入工具包
import numpy as np
import pandas as pd
import matplotlib.pyplot as plt
import seaborn as sns
from scipy import stats

import warnings
warnings.filterwarnings("ignore")

%matplotlib inline
2.3 读取数据
data_path = '比赛/天猫复购预测之挑战Baseline/datasets/' # 数据路径
user_log = pd.read_csv(data_path + 'data_format1/user_log_format1.csv')
user_info = pd.read_csv(data_path + 'data_format1/user_info_format1.csv')
train_data = pd.read_csv(data_path + 'data_format1/train_format1.csv')
test_data = pd.read_csv(data_path + 'data_format1/test_format1.csv')
sample_submission = pd.read_csv(data_path + 'sample_submission.csv')
2.4 数据集样例查看
2.5 查看数据类型和数据大小
2.6 查看缺失值
2.7 观察数据分布
2.7.1 查看整体数据统计
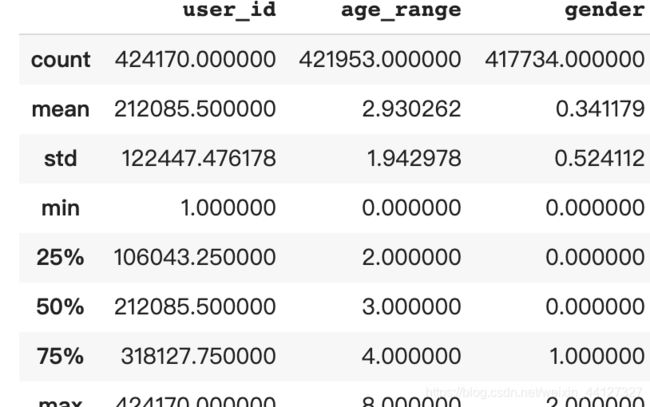
user_info.describe()
user_log.describe()
2.7.2 查看正负样本的分布,并可视化
label_gp = train_data.groupby('label')['user_id'].count()
print('正负样本的数量: \n',label_gp)

_,axe = plt.subplot(1,2,figsize=(12,6))
train_data.label.value_counts().plot(kind='pie',autopct='%1.1f%%',shadow = True,explode = [0,0.1],ax= axe[0])
sns.countplot('label',data=train_data,ax=axe[1],)
正负样本的数量:
 label
0    244912
1     15952
Name: user_id, dtype: int64
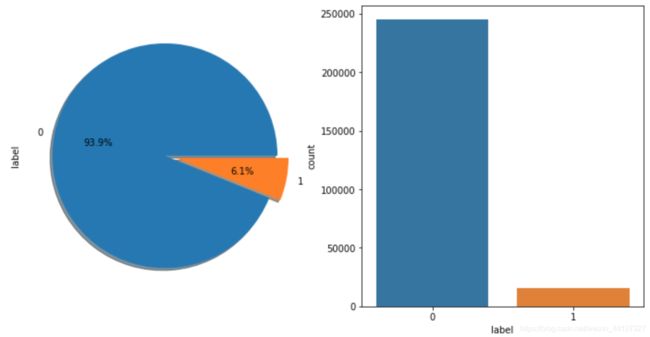
从图中可以看出,样本的分布不均衡,需要采取一定的措施处理样本,如采用过采样技术,训练多个模型后求平均或者调整模型的损失函数样本比例的权重等。
2.8 探查影响复购的各种影响因素
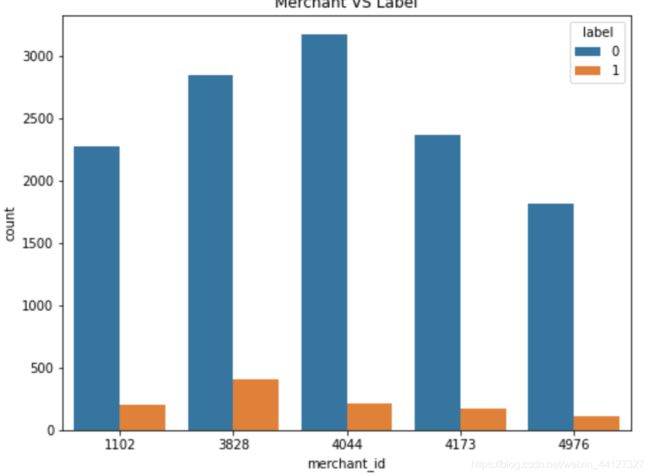
2.8.1 店铺分析
- 分析不同店铺与复购的关系
print('选取top5 店铺\n店铺\t购买次数')
print(train_data.merchant_id.value_counts().head(5))
train_data_merchant = train_data.copy()
train_data_merchant['TOP5'] = train_data_merchant['merchant_id'].map(lambda x: 1 if x in [4044,3828,4173,1102,4976] else 0)
train_data_merchant = train_data_merchant[train_data_merchant['TOP5'] == 1]
plt.figure(figsize=(8,6))
plt.title('Merchant VS Label')
sax = sns.countplot('merchant_id',hue='label',data=train_data_merchant)
选取top5 店铺
店铺	购买次数
4044    3379
3828    3254
4173    2542
1102    2483
4976    1925
Name: merchant_id, dtype: int64
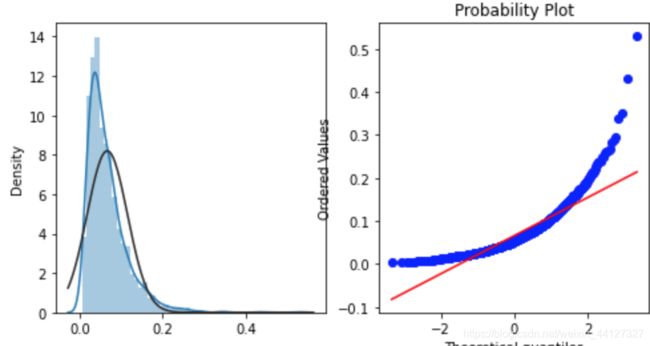
- 查看店铺的复购分布
merchant_repeat_buy = [rate for rate in train_data.groupby(['merchant_id'])['label'].mean() if rate <= 1 and rate > 0]
plt.figure(figsize=(8,4))

ax = plt.subplot(1,2,1)
sns.distplot(merchant_repeat_buy, fit = stats.norm)
ax = plt.subplot(1,2,2)
res = stats.probplot(merchant_repeat_buy,plot=plt)
2.8.2 用户分析
user_repeat_buy = [
                   rate for rate in train_data.groupby(['user_id'])['label'].mean()
                   if rate <= 1 and rate > 0
]
plt.figure(figsize=(12,6))

ax = plt.subplot(1,2,1)
sns.distplot(user_repeat_buy, fit = stats.norm)
ax = plt.subplot(1,2,2)
res = stats.probplot(user_repeat_buy,plot=plt)
2.8.3 用户性别分析
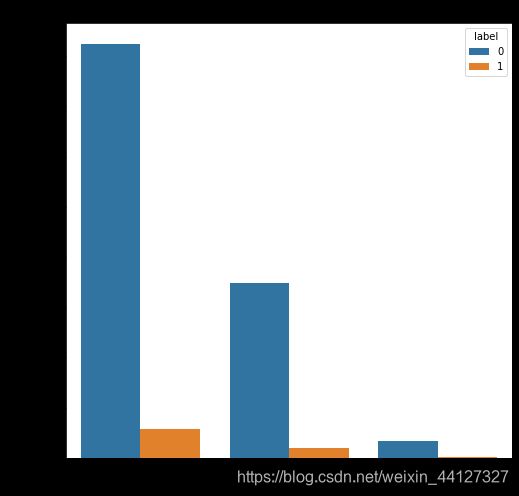
- 分析用户性别与复购的关系,并可视化
train_data_user_info = train_data.merge(user_info,on=['user_id'],how='left')

plt.figure(figsize=(8,8))
plt.title('Gender VS Label')
ax = sns.countplot('gender',hue = 'label',data = train_data_user_info)
for p in ax.patches:
  height = p.get_height()
- 查看用户性别复购的分布
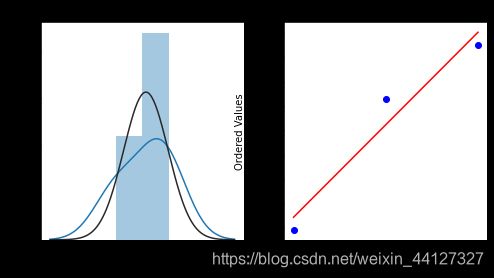
repeat_buy = [rate for rate in train_data_user_info.groupby(['gender'])['label'].mean()]
plt.figure(figsize = (8,4))

ax = plt.subplot(1,2,1)
sns.distplot(repeat_buy,fit=stats.norm)
ax = plt.subplot(1,2,2)
res = stats.probplot(repeat_buy,plot = plt)
2.8.4 用户年龄分析
- 分析用户年龄与复购的关系
plt.figure(figsize = (8,8))
plt.title('Age VS Label')
ax = sns.countplot('age_range',hue = 'label',data=train_data_user_info)
- 查看用户年龄复购分布
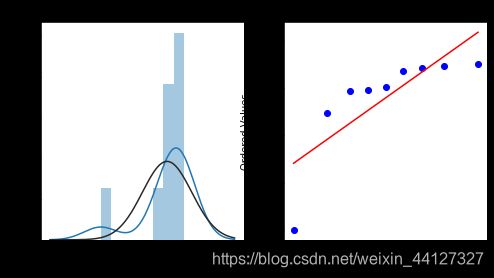
repeat_buy = [rate for rate in train_data_user_info.groupby(['age_range'])['label'].mean()]

plt.figure(figsize = (8,4))
ax = plt.subplot(1,2,1)
sns.distplot(repeat_buy,fit=stats.norm)
ax = plt.subplot(1,2,2)
res = stats.probplot(repeat_buy,plot=plt)
