工具系列:TimeGPT_(3)处理假期和特殊日期
日历变量和特殊日期是预测应用中最常见的外生变量类型之一。它们为时间序列的当前状态提供了额外的上下文信息,特别是对于基于窗口的模型(如TimeGPT-1)而言。这些变量通常包括添加每个观测的月份、周数、日期或小时数的信息。例如,在高频小时数据中,提供年份的当前月份比输入窗口中有限的历史信息更有意义,可以改善预测结果。
在本教程中,我们将展示如何使用date_features函数自动向数据集中添加日历变量。
from nixtlats.utils import colab_badge
colab_badge('docs/tutorials/2_holidays')
# 导入load_dotenv函数,用于加载.env文件中的环境变量
from fastcore.test import test_eq, test_fail, test_warns
from dotenv import load_dotenv
load_dotenv()
True
import pandas as pd
from nixtlats import TimeGPT
/home/ubuntu/miniconda/envs/nixtlats/lib/python3.11/site-packages/statsforecast/core.py:25: TqdmWarning: IProgress not found. Please update jupyter and ipywidgets. See https://ipywidgets.readthedocs.io/en/stable/user_install.html
  from tqdm.autonotebook import tqdm
# 创建一个TimeGPT对象,传入token参数,如果没有传入则默认使用环境变量中的TIMEGPT_TOKEN
timegpt = TimeGPT(token='my_token_provided_by_nixtla')
# 创建一个TimeGPT对象
timegpt = TimeGPT()
鉴于日历变量的主导使用,我们将常见日历变量的自动创建作为预处理步骤包含在预测方法中。要自动添加日历变量,请使用“date_features”参数。
# 从指定的URL读取CSV文件,并将其存储在名为pltr_df的数据框中
pltr_df = pd.read_csv('https://raw.githubusercontent.com/Nixtla/transfer-learning-time-series/main/datasets/openbb/pltr.csv')
# 导入所需的模块和函数已在代码中完成,无需再次导入

# 使用timegpt模块的forecast函数进行时间序列预测,并将结果赋值给fcst_pltr_calendar_df变量
# 参数说明:
# - df:传入的数据框,这里使用pltr_df的最后28个数据作为输入数据
# - h:预测的时间步长,这里预测未来14个时间步
# - freq:时间序列的频率,这里使用工作日频率(Business Day)
# - time_col:时间列的名称,这里使用'date'作为时间列
# - target_col:目标列的名称,这里使用'Close'作为目标列
# - date_features:需要使用的日期特征,这里使用'month'和'weekday'作为日期特征
fcst_pltr_calendar_df = timegpt.forecast(
    df=pltr_df.tail(2 * 14), h=14, freq='B',
    time_col='date', target_col='Close',
    date_features=['month','weekday']
)

# 输出预测结果的前几行
fcst_pltr_calendar_df.head()
INFO:nixtlats.timegpt:Validating inputs...
INFO:nixtlats.timegpt:Preprocessing dataframes...
WARNING:nixtlats.timegpt:The specified horizon "h" exceeds the model horizon. This may lead to less accurate forecasts. Please consider using a smaller horizon.
INFO:nixtlats.timegpt:Calling Forecast Endpoint...
| date | TimeGPT | |
|---|---|---|
| 0 | 2023-09-25 | 14.677374 |
| 1 | 2023-09-26 | 14.825757 |
| 2 | 2023-09-27 | 15.126798 |
| 3 | 2023-09-28 | 14.398899 |
| 4 | 2023-09-29 | 14.387407 |
# 导入timegpt模块中的plot函数

# 使用plot函数绘制图表,传入以下参数:
# - pltr_df: 数据框,包含要绘制的数据
# - fcst_pltr_calendar_df: 数据框,包含要绘制的预测数据
# - id_col: 字符串,指定数据框中表示系列ID的列名
# - time_col: 字符串,指定数据框中表示时间的列名
# - target_col: 字符串,指定数据框中表示目标变量的列名
# - max_insample_length: 整数,指定用于训练模型的最大样本数量
timegpt.plot(
    pltr_df,
    fcst_pltr_calendar_df,
    id_col='series_id',
    time_col='date',
    target_col='Close',
    max_insample_length=90,
)
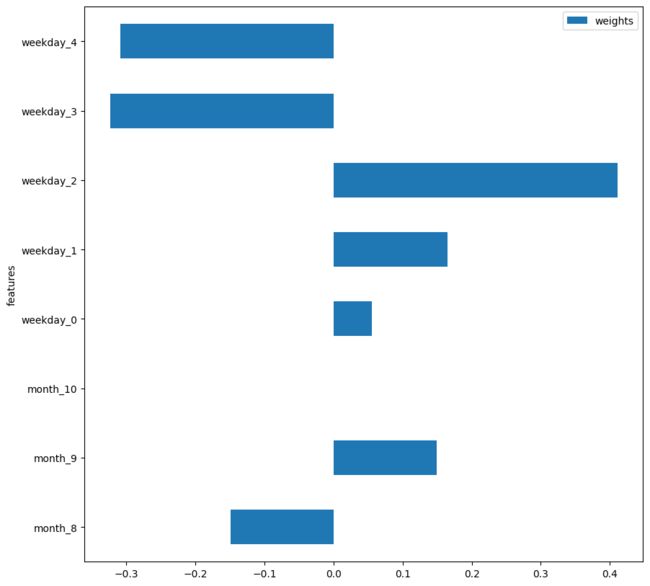
我们还可以绘制每个日期特征的重要性。
timegpt.weights_x.plot.barh(x='features', y='weights', figsize=(10, 10))
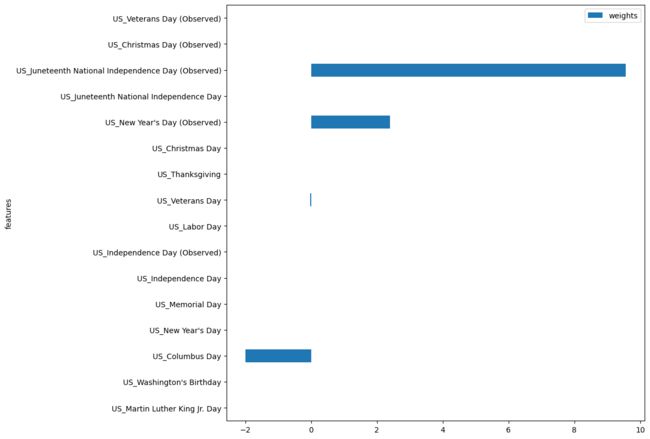
您还可以使用CountryHolidays类添加国家假日。
# 导入nixtlats.date_features模块中的CountryHolidays类

from nixtlats.date_features import CountryHolidays
# 导入所需模块和函数

# 使用timegpt.forecast函数进行时间序列预测,将预测结果保存在fcst_pltr_calendar_df中
# 参数df为输入的数据框pltr_df,h为预测的时间步数14,freq为频率为工作日'B',time_col为时间列'date',target_col为目标列'Close',date_features为日期特征,这里使用了CountryHolidays函数来指定美国的假日
fcst_pltr_calendar_df = timegpt.forecast(
    df=pltr_df, h=14, freq='B',
    time_col='date', target_col='Close',
    date_features=[CountryHolidays(['US'])]
)

# 使用timegpt.weights_x.plot.barh函数绘制水平条形图,x轴为特征'features',y轴为权重'weights',图像大小为(10, 10)
timegpt.weights_x.plot.barh(x='features', y='weights', figsize=(10, 10))
INFO:nixtlats.timegpt:Validating inputs...
INFO:nixtlats.timegpt:Preprocessing dataframes...
WARNING:nixtlats.timegpt:The specified horizon "h" exceeds the model horizon. This may lead to less accurate forecasts. Please consider using a smaller horizon.
INFO:nixtlats.timegpt:Calling Forecast Endpoint...
以下是date_features参数的详细说明:
-
date_features(bool或str列表或可调用对象):此参数指定要考虑的日期属性。- 如果设置为
True,模型将自动添加与给定数据框(df)的频率相关的最常见日期特征。对于每日频率,这可能包括星期几、月份和年份等特征。 - 如果提供了一个字符串列表,它将考虑那些特定的日期属性。例如,
date_features=['weekday', 'month']将只添加星期几和月份作为特征。 - 如果提供了一个可调用对象,它应该是一个以日期为输入并返回所需特征的函数。这样可以灵活地计算自定义日期特征。
- 如果设置为
-
date_features_to_one_hot(bool或str列表):确定日期特征后,可能希望对其进行独热编码,特别是如果它们是分类的(例如星期几)。独热编码将这些分类特征转换为二进制矩阵,使它们更适合许多机器学习算法。- 如果
date_features=True,则默认情况下,所有计算得到的日期特征将进行独热编码。 - 如果提供了一个字符串列表,只有那些特定的日期特征将进行独热编码。
- 如果
通过利用date_features和date_features_to_one_hot参数,可以有效地将日期属性的时间效应纳入到预测模型中,从而提高其准确性和可解释性。


