使用Matplotlib绘制3d图形
目录
一:绘制一个正方体
二:绘制一个3*3*3魔方
为了绘制立体,主要用到Matplotlib中的一个函数voxels
voxels([x, y, z, ], filled, facecolors=None, edgecolors=None, **kwargs)
绘制一组填充体素,所有体素在坐标轴上绘制为1x1x1立方体,filled[0, 0, 0]的lower corner位于原点。被遮挡的面不再绘制。
一:绘制一个正方体
# 准备一组体素坐标
n_voxels = np.ones((1,1,1), dtype=bool)
# 绘制
ax = plt.figure().add_subplot(projection='3d')
ax.voxels(n_voxels)
plt.show()

二:绘制一个3*3*3魔方
(1) 填充体素,绘制
n_voxels = np.ones((3,33), dtype=bool)
# 绘制
ax = plt.figure().add_subplot(projection='3d')
ax.voxels(n_voxels)
plt.show()

(2)增加间隙
可以对3x3x3的体素进行上采样,即构建一个5x5x5的体素,这样在每一个维度,让处于两个体素中间的体素不显示,即可产生间隙的效果。
# 准备一组体素坐标
n_voxels = np.ones((3,3,3), dtype=bool)
size = np.array(n_voxels.shape) * 2
filled = np.zeros(size - 1, dtype=n_voxels.dtype)
filled[::2, ::2, ::2] = n_voxels
# 绘制
ax = plt.figure().add_subplot(projection='3d')
ax.voxels(filled)
plt.show()

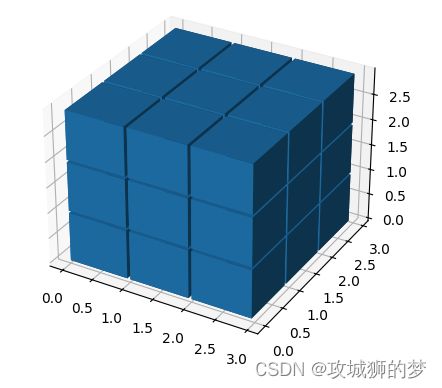
(3)缩小间隙,保持美观
# 准备一组体素坐标
n_voxels = np.ones((3,3,3), dtype=bool)
size = np.array(n_voxels.shape) * 2
filled = np.zeros(size - 1, dtype=n_voxels.dtype)
filled[::2, ::2, ::2] = n_voxels
# 缩小间隙
# 构建voxels顶点控制网格
# x, y, z均为6x6x6的矩阵,为voxels的网格
# //2是为了,把索引范围从[0 1 2 3 4 5]转换为[0 0 1 1 2 2],这样x,y,z范围就回到了0~3
x, y, z = np.indices(np.array(filled.shape) + 1).astype(float) // 2
x[1::2, :, :] += 0.95
y[:, 1::2, :] += 0.95
z[:, :, 1::2] += 0.95
# 绘制
ax = plt.figure().add_subplot(projection='3d')
ax.voxels(x, y, z,filled)
plt.show()
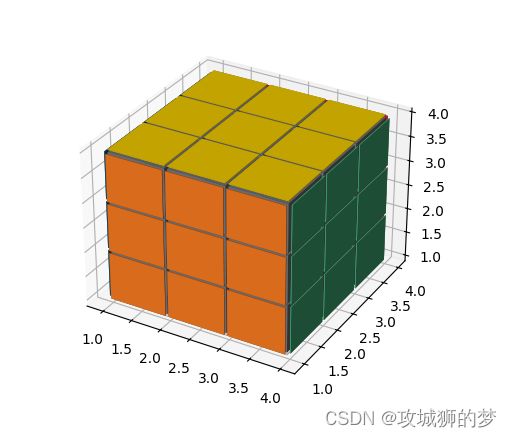
(4)绘制面颜色
由于只能给每个体素整体一个颜色,不能对一个体素的不同面指定不同的颜色,所以为了实现六个面不同颜色,只能将3x3x3的矩阵改为5x5x5,将最外边的那一层体素厚度设小一点,近似于面,然后赋颜色。
# 准备一组体素坐标
n_voxels = np.ones((5,5,5), dtype=bool)
size = np.array(n_voxels.shape) * 2
filled = np.zeros(size - 1, dtype=n_voxels.dtype)
filled[::2, ::2, ::2] = n_voxels
# 缩小间隙
# 构建voxels顶点控制网格
# x, y, z均为6x6x6的矩阵,为voxels的网格
# //2是为了,把索引范围从[0 1 2 3 4 5]转换为[0 0 1 1 2 2],这样x,y,z范围就回到了0~3
x, y, z = np.indices(np.array(filled.shape) + 1).astype(float) // 2
x[1::2, :, :] += 0.95
y[:, 1::2, :] += 0.95
z[:, :, 1::2] += 0.95
x[0, :, :] += 0.94
y[:, 0, :] += 0.94
z[:, :, 0] += 0.94
x[-1, :, :] -= 0.94
y[:, -1, :] -= 0.94
z[:, :, -1] -= 0.94
# 给魔方六个面赋予不同的颜色
colors = np.array(['#ffd400', "#fffffb", "#f47920", "#d71345", "#145b7d", "#45b97c"])
facecolors = np.full(filled.shape, '#77787b') # 设一个灰色的基调
facecolors[:, :, -1] = colors[0]
facecolors[:, :, 0] = colors[1]
facecolors[:, 0, :] = colors[2]
facecolors[:, -1, :] = colors[3]
facecolors[0, :, :] = colors[4]
facecolors[-1, :, :] = colors[5]
filled[0, 0, :] = 0
filled[0, -1, :] = 0
filled[-1, 0, :] = 0
filled[-1, -1, :] = 0
filled[:, 0, 0] = 0
filled[:, 0, -1] = 0
filled[:, -1, 0] = 0
filled[:, -1, -1] = 0
filled[0, :, 0] = 0
filled[0, :, -1] = 0
filled[-1, :, 0] = 0
filled[-1, :, -1] = 0
# 绘制
ax = plt.figure().add_subplot(projection='3d')
ax.voxels(x, y, z,filled,facecolors=facecolors)
plt.show()