MATLAB | 绘图复刻(十五) | 环形聚类树状图
本期复刻效果:

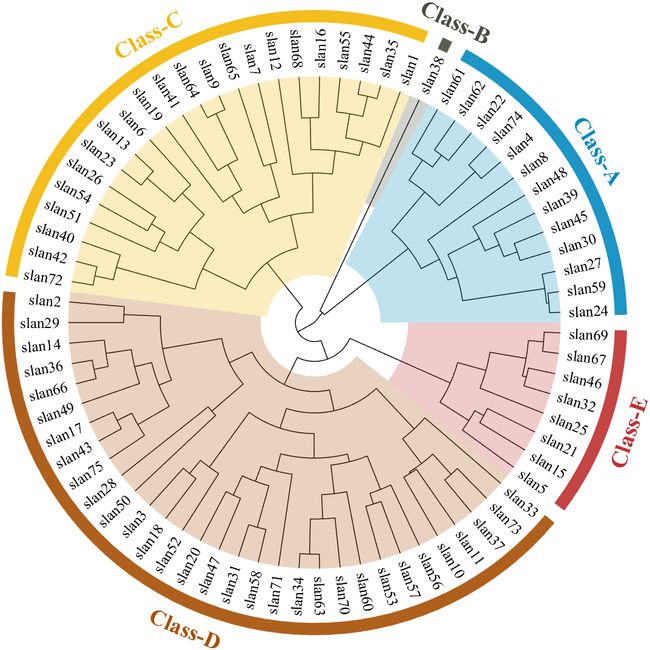
感觉出的聚类分析树状图绘制工具也不少了,未来可能会统一整理为一个工具包?(任重道远,道阻且长):
代码讲解
0 数据设置
写了比较多的注释应该比较易懂:
clc; clear; close all

% 样品起名slan1 slan2 slan3...slan75
sampleName = compose('slan%d', 1:75);

% 随机生成数据
% rng(10)
Data = rand(75,3);

% 分类数
N = 5;

% 分类名 Class-A Class-B...
className = compose('Class-%c', 64 + (1:N));

% 设置字体
sampleFont = {'FontSize', 12, 'FontName', 'Times New Roman'};
classFont = {'FontSize', 18, 'FontName', 'Times New Roman', 'FontWeight', 'bold'};

% 设置半径(树状图半径为1)
% 样本文本 类弧形内侧 类弧形外侧 类文本
RSet = [1+1/30, 1.22, 1.27, 1.35];
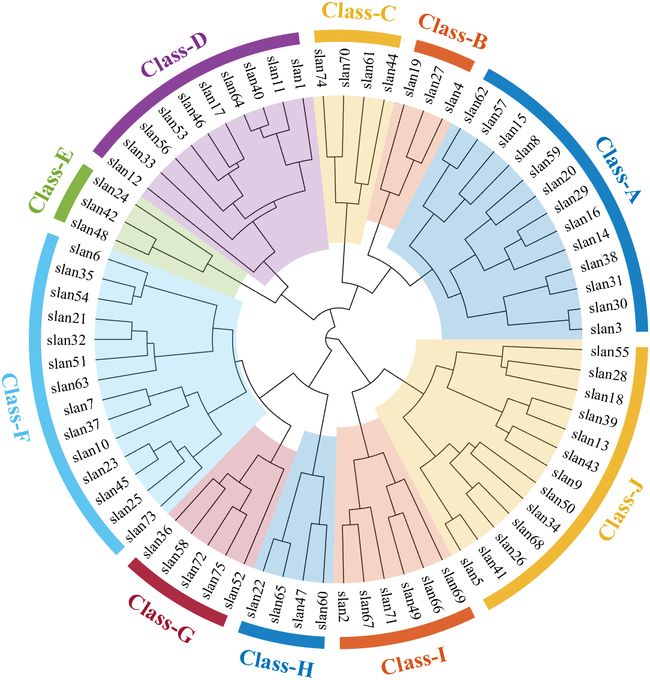
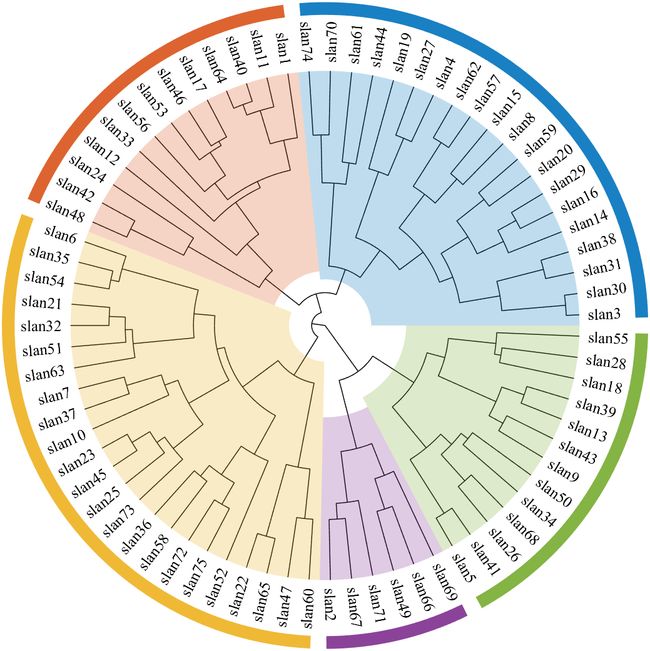
分类数N不宜设置太大,不然会出现比较多一个样本就是一个类的情况:
1 配色
这里使用的是MATLAB自带lines配色:
% 配色
CList = lines(N);
当然也比较推荐使用我写的slanCL配色包:https://slandarer.blog.csdn.net/article/details/129828666
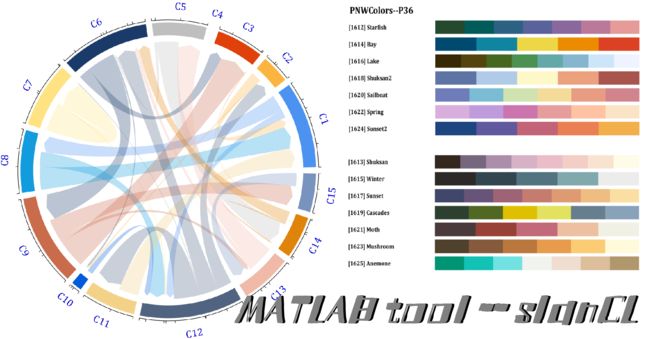
给几个比较好看的配色:
% CList = slanCL(251,1:N);
% CList = slanCL(495,1:N);
% CList = slanCL(1838,1:N);
% CList = slanCL(319,1:N);
% CList = slanCL(361,1:N);
% CList = slanCL(455,1:N);
251

495

1838

2 创建绘图图窗
fig1 = figure('Units', 'normalized', 'Position', [.1,.1,.5,.8], 'Color', 'w');
ax1 = gca;
ax1.NextPlot = 'add';
ax1.DataAspectRatio = [1,1,1];
ax1.XColor = 'none';
ax1.YColor = 'none';
axis tight
fig2 = figure();
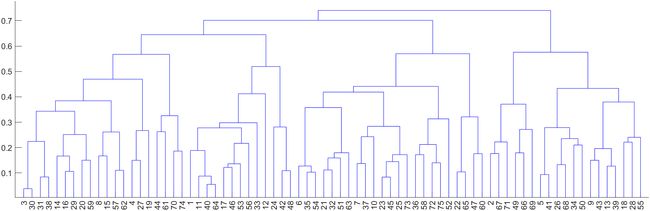
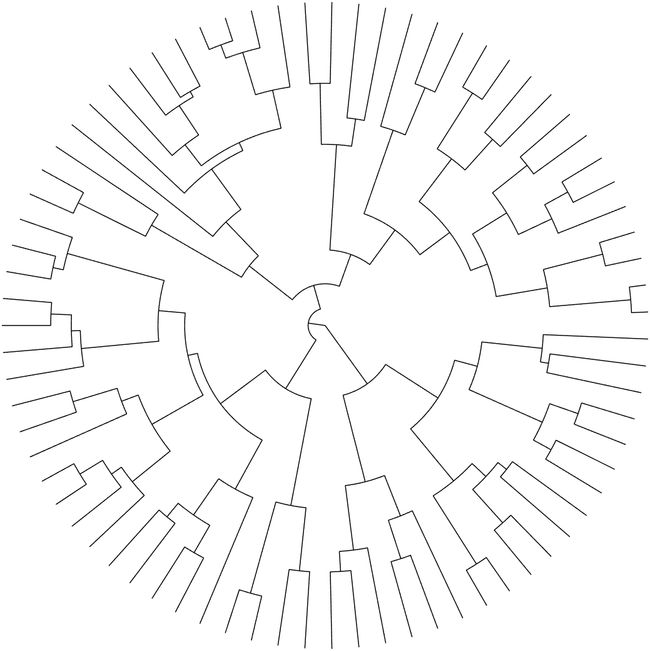
3 数据处理、绘制树状图、提取图形、关闭图窗
Z = linkage(Data,'average');
T = cluster(Z,'maxclust',N);
cutoff = median([Z(end-(N-1),3), Z(end-(N-2),3)]);
[LineSet, ~, order] = dendrogram(Z, 0, 'Orientation', 'top');
XSet = reshape([LineSet(:).XData], 4, []).';
YSet = reshape([LineSet(:).YData], 4, []).';
close(fig2)
4 环形树状图
% 角度转换数据预处理
TT = T(order);
theta1 = 0;
theta2 = pi*2;
theta3 = (theta2-theta1)./size(Data,1);
theta4 = theta1 + theta3/2;
theta5 = theta2 - theta3/2;
maxY = max(max(YSet));
tS = linspace(0,1,50);

% 绘制环形树状图
tT = theta4 + (theta5-theta4).*(XSet-1)./(size(Data,1)-1);
tR = maxY-YSet;
tR = [tR(:,1), tR(:,2).*ones(1,50), tR(:,4)].';
tT = [tT(:,1), tT(:,2)+tS.*(tT(:,3)-tT(:,2)), tT(:,4)].';
plot(ax1, tR.*cos(tT), tR.*sin(tT), 'Color', 'k', 'LineWidth', .7);
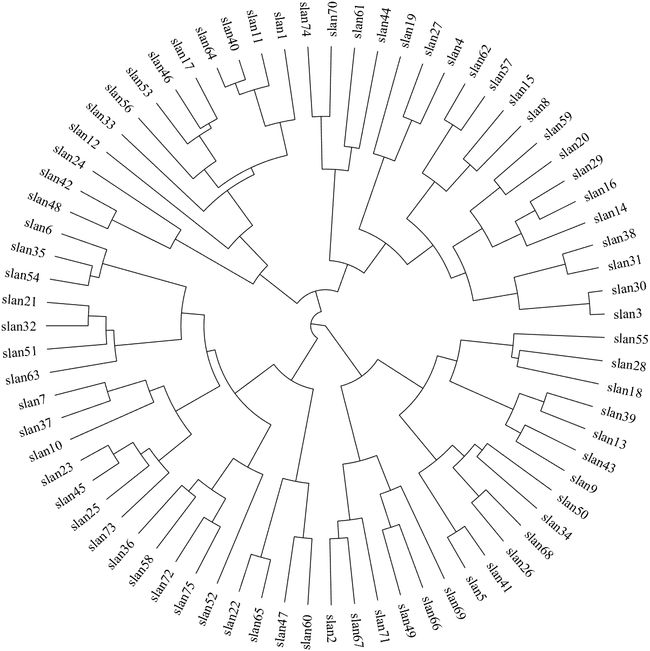
5 添加标签文本
% 绘制样本名称标签
for i = 1:length(order)
    tT = theta4 + (theta5-theta4).*(i-1)./(size(Data,1)-1);
    if tT<pi/2 || tT>3*pi/2
        text(ax1, maxY.*RSet(1).*cos(tT), maxY.*RSet(1).*sin(tT), sampleName{order(i)},...
        'FontSize', 12, 'Rotation', tT./pi.*180, sampleFont{:});
    else
        text(ax1, maxY.*RSet(1).*cos(tT), maxY.*RSet(1).*sin(tT), sampleName{order(i)},...
        'FontSize', 12, 'Rotation', tT./pi.*180+180, 'HorizontalAlignment', 'right', sampleFont{:});
    end
end
6 绘制聚类信息
% 绘制分类信息
XSet = [XSet(:,1:2); XSet(:,3:4)];
YSet = [YSet(:,1:2); YSet(:,3:4)];
BSet = (YSet(:,1)-cutoff).*(YSet(:,2)-cutoff)<0;
HSet = (YSet(BSet,1)+YSet(BSet,2))./2;
Cset = TT(round(XSet(BSet,1)));
classNum = unique(TT, 'stable');

for i = 1:length(classNum)
    % 绘制内部分类扇形
    tX = [find(TT==classNum(i),1,'first')-.5, find(TT==classNum(i),1,'last')+.5];
    tR = [maxY-HSet(Cset==classNum(i)), maxY];
    tT = theta4 + (theta5-theta4).*(tX-1)./(size(Data,1)-1);
    tR = [tR(1), tR(2).*ones(1,50), tR(1), tR(1).*ones(1,50)];
    tT = [tT(1), tT(1)+tS.*(tT(2)-tT(1)), tT(2), tT(2)+tS.*(tT(1)-tT(2))];
    patch(ax1, tR.*cos(tT), tR.*sin(tT), CList(i,:), 'EdgeColor', 'none', 'FaceAlpha', .25);

    % 绘制外部分类扇形
    tX = [find(TT==classNum(i),1,'first')-.2, find(TT==classNum(i),1,'last')+.2];
    tR = maxY.*RSet(1,2:3);
    tT = theta4 + (theta5-theta4).*(tX-1)./(size(Data,1)-1);
    tR = [tR(1), tR(2).*ones(1,50), tR(1), tR(1).*ones(1,50)];
    tT = [tT(1), tT(1)+tS.*(tT(2)-tT(1)), tT(2), tT(2)+tS.*(tT(1)-tT(2))];
    patch(ax1, tR.*cos(tT), tR.*sin(tT), CList(i,:), 'EdgeColor', 'none', 'FaceAlpha', .9);

    % 绘制分类信息标签
    tT = mean(tT);
    if tT<pi
        text(ax1, maxY.*RSet(4).*cos(tT), maxY.*RSet(4).*sin(tT), className{i}, 'Color', CList(i,:),...
        'FontSize', 16, 'Rotation', tT./pi.*180-90, 'HorizontalAlignment', 'center', classFont{:});
    else
        text(ax1, maxY.*RSet(4).*cos(tT), maxY.*RSet(4).*sin(tT), className{i}, 'Color', CList(i,:),...
        'FontSize', 16, 'Rotation', tT./pi.*180+180-90, 'HorizontalAlignment', 'center', classFont{:});
    end
end

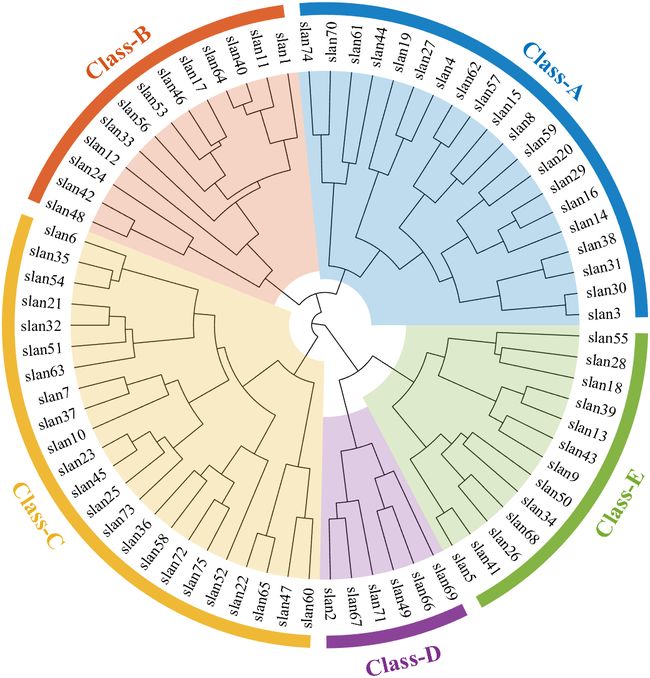
完整代码
% clusterTreeDemo
% Copyright (c) 2024, Zhaoxu Liu / slandarer

clc; clear; close all

% 样品起名slan1 slan2 slan3...slan75
sampleName = compose('slan%d', 1:75);

% 随机生成数据
% rng(10)
Data = rand(75,3);

% 分类数
N = 5;

% 分类名 Class-A Class-B...
className = compose('Class-%c', 64 + (1:N));

% 设置字体
sampleFont = {'FontSize', 12, 'FontName', 'Times New Roman'};
classFont = {'FontSize', 18, 'FontName', 'Times New Roman', 'FontWeight', 'bold'};

% 设置半径(树状图半径为1)
% 样本文本 类弧形内侧 类弧形外侧 类文本
RSet = [1+1/30, 1.22, 1.27, 1.35];

% 配色
CList = lines(N);
% CList = slanCL(251,1:N);
% CList = slanCL(495,1:N);
% CList = slanCL(1838,1:N);
% CList = slanCL(319,1:N);
% CList = slanCL(361,1:N);
% CList = slanCL(455,1:N);

% =========================================================================
% 绘图部分代码
% -------------------------------------------------------------------------
% 创建绘图图窗
fig1 = figure('Units', 'normalized', 'Position', [.1,.1,.5,.8], 'Color', 'w');
ax1 = gca;
ax1.NextPlot = 'add';
ax1.DataAspectRatio = [1,1,1];
ax1.XColor = 'none';
ax1.YColor = 'none';
axis tight
fig2 = figure();

% 数据处理、绘制树状图、提取图形、关闭图窗
Z = linkage(Data,'average');
T = cluster(Z,'maxclust',N);
cutoff = median([Z(end-(N-1),3), Z(end-(N-2),3)]);
[LineSet, ~, order] = dendrogram(Z, 0, 'Orientation', 'top');
XSet = reshape([LineSet(:).XData], 4, []).';
YSet = reshape([LineSet(:).YData], 4, []).';
close(fig2)

% 角度转换数据预处理
TT = T(order);
theta1 = 0;
theta2 = pi*2;
theta3 = (theta2-theta1)./size(Data,1);
theta4 = theta1 + theta3/2;
theta5 = theta2 - theta3/2;
maxY = max(max(YSet));
tS = linspace(0,1,50);

% 绘制环形树状图
tT = theta4 + (theta5-theta4).*(XSet-1)./(size(Data,1)-1);
tR = maxY-YSet;
tR = [tR(:,1), tR(:,2).*ones(1,50), tR(:,4)].';
tT = [tT(:,1), tT(:,2)+tS.*(tT(:,3)-tT(:,2)), tT(:,4)].';
plot(ax1, tR.*cos(tT), tR.*sin(tT), 'Color', 'k', 'LineWidth', .7);

% 绘制样本名称标签
for i = 1:length(order)
    tT = theta4 + (theta5-theta4).*(i-1)./(size(Data,1)-1);
    if tT<pi/2 || tT>3*pi/2
        text(ax1, maxY.*RSet(1).*cos(tT), maxY.*RSet(1).*sin(tT), sampleName{order(i)},...
        'FontSize', 12, 'Rotation', tT./pi.*180, sampleFont{:});
    else
        text(ax1, maxY.*RSet(1).*cos(tT), maxY.*RSet(1).*sin(tT), sampleName{order(i)},...
        'FontSize', 12, 'Rotation', tT./pi.*180+180, 'HorizontalAlignment', 'right', sampleFont{:});
    end
end

% 绘制分类信息
XSet = [XSet(:,1:2); XSet(:,3:4)];
YSet = [YSet(:,1:2); YSet(:,3:4)];
BSet = (YSet(:,1)-cutoff).*(YSet(:,2)-cutoff)<0;
HSet = (YSet(BSet,1)+YSet(BSet,2))./2;
Cset = TT(round(XSet(BSet,1)));
classNum = unique(TT, 'stable');

for i = 1:length(classNum)
    % 绘制内部分类扇形
    tX = [find(TT==classNum(i),1,'first')-.5, find(TT==classNum(i),1,'last')+.5];
    tR = [maxY-HSet(Cset==classNum(i)), maxY];
    tT = theta4 + (theta5-theta4).*(tX-1)./(size(Data,1)-1);
    tR = [tR(1), tR(2).*ones(1,50), tR(1), tR(1).*ones(1,50)];
    tT = [tT(1), tT(1)+tS.*(tT(2)-tT(1)), tT(2), tT(2)+tS.*(tT(1)-tT(2))];
    patch(ax1, tR.*cos(tT), tR.*sin(tT), CList(i,:), 'EdgeColor', 'none', 'FaceAlpha', .25);

    % 绘制外部分类扇形
    tX = [find(TT==classNum(i),1,'first')-.2, find(TT==classNum(i),1,'last')+.2];
    tR = maxY.*RSet(1,2:3);
    tT = theta4 + (theta5-theta4).*(tX-1)./(size(Data,1)-1);
    tR = [tR(1), tR(2).*ones(1,50), tR(1), tR(1).*ones(1,50)];
    tT = [tT(1), tT(1)+tS.*(tT(2)-tT(1)), tT(2), tT(2)+tS.*(tT(1)-tT(2))];
    patch(ax1, tR.*cos(tT), tR.*sin(tT), CList(i,:), 'EdgeColor', 'none', 'FaceAlpha', .9);

    % 绘制分类信息标签
    tT = mean(tT);
    if tT<pi
        text(ax1, maxY.*RSet(4).*cos(tT), maxY.*RSet(4).*sin(tT), className{i}, 'Color', CList(i,:),...
        'FontSize', 16, 'Rotation', tT./pi.*180-90, 'HorizontalAlignment', 'center', classFont{:});
    else
        text(ax1, maxY.*RSet(4).*cos(tT), maxY.*RSet(4).*sin(tT), className{i}, 'Color', CList(i,:),...
        'FontSize', 16, 'Rotation', tT./pi.*180+180-90, 'HorizontalAlignment', 'center', classFont{:});
    end
end
完
以上已经是本文全部内容,若懒得一一获取代码,可以去以下gitee仓库获取全部代码:
https://gitee.com/slandarer/PLTreprint/