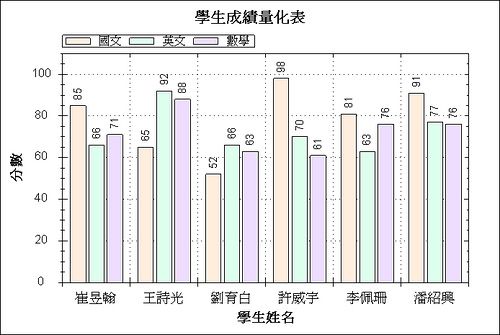
使用 ZedGraph 製作統計圖

     //

     記得要加入參考


     using

      ZedGraph;


     //

     資料來源


     private

      DataTable getDT()
{
 DataTable dt

     =


     new

      DataTable();
 dt.Columns.Add(

     "

     學號

     "

     , System.Type.GetType(

     "

     System.String

     "

     ));
 dt.Columns.Add(

     "

     姓名

     "

     , System.Type.GetType(

     "

     System.String

     "

     ));
 dt.Columns.Add(

     "

     國文

     "

     , System.Type.GetType(

     "

     System.Int32

     "

     ));
 dt.Columns.Add(

     "

     英文

     "

     , System.Type.GetType(

     "

     System.Int32

     "

     ));
 dt.Columns.Add(

     "

     數學

     "

     , System.Type.GetType(

     "

     System.Int32

     "

     ));

 dt.Rows.Add(

     "

     B9510001

     "

     ,

     "

     崔昱翰

     "

     ,

     85

     ,

     66

     ,

     71

     );
 dt.Rows.Add(

     "

     B9510002

     "

     ,

     "

     王詩光

     "

     ,

     65

     ,

     92

     ,

     88

     );
 dt.Rows.Add(

     "

     B9510003

     "

     ,

     "

     劉育白

     "

     ,

     52

     ,

     66

     ,

     63

     );
 dt.Rows.Add(

     "

     B9510004

     "

     ,

     "

     許威宇

     "

     ,

     98

     ,

     70

     ,

     61

     );
 dt.Rows.Add(

     "

     B9510005

     "

     ,

     "

     李佩珊

     "

     ,

     81

     ,

     63

     ,

     76

     );
 dt.Rows.Add(

     "

     B9510006

     "

     ,

     "

     潘紹興

     "

     ,

     91

     ,

     77

     ,

     76

     );


     return

      dt;
}


     //

     學生成績


     public


     void

      StudentChart1(ZedGraphControl zgc)
{


     //

      Google網域搜尋:Fill site:

     http://zedgraph.sourceforge.net/documentation


 GraphPane myPane

     =

      zgc.GraphPane;


     //


      DataTable dt

     =

      getDT();


     //

      Set the title and axis labels


      myPane.Title.Text

     =


     "

     學生成績量化表

     "

     ;
 myPane.XAxis.Title.Text

     =


     "

     學生姓名

     "

     ;
 myPane.YAxis.Title.Text

     =


     "

     分數

     "

     ;

 PointPairList list1

     =


     new

      PointPairList();
 PointPairList list2

     =


     new

      PointPairList();
 PointPairList list3

     =


     new

      PointPairList();

 Random rand

     =


     new

      Random();


     //

      Generate random data for three curves


     for

      (

     int

      i

     =


     0

     ; i

     <

     dt.Rows.Count; i

     ++

     )
 {


     double

      x

     =

      (

     double

     )i;


     double

      y1_chian

     =

      Convert.ToDouble(dt.Rows[i][

     "

     國文

     "

     ]);


     double

      y2_eng

     =

      Convert.ToDouble(dt.Rows[i][

     "

     英文

     "

     ]);


     double

      y3_math

     =

      Convert.ToDouble(dt.Rows[i][

     "

     數學

     "

     ]);
 list1.Add(x, y1_chian);
 list2.Add(x, y2_eng);
 list3.Add(x, y3_math);
 }


     //

      create the curves


     //

      BarItem.Bar.Fill(Color) 填入單一顏色


     //

      BarItem.Bar.Fill(Color, Color, Color, 90) 填入漸層顏色,第4參數是旋轉角度


      BarItem myCurve1

     =

      myPane.AddBar(

     "

     國文

     "

     , list1, Color.Red);
 myCurve1.Bar.Fill

     =


     new

      Fill(Color.FromArgb(

     255

     ,

     238

     ,

     221

     ));

 BarItem myCurve2

     =

      myPane.AddBar(

     "

     英文

     "

     , list2, Color.Blue);
 myCurve2.Bar.Fill

     =


     new

      Fill(Color.FromArgb(

     221

     ,

     255

     ,

     238

     ));

 BarItem myCurve3

     =

      myPane.AddBar(

     "

     數學

     "

     , list3, Color.Green);
 myCurve3.Bar.Fill

     =


     new

      Fill(Color.FromArgb(

     238

     ,

     221

     ,

     255

     ));


     //

      Fill the axis background with a color gradient


     //

      背景色


     //

      myPane.Chart.Fill = new Fill(Color.White, Color.FromArgb(255, 255, 166), 45.0F);


 myPane.XAxis.MajorTic.IsBetweenLabels

     =


     true

     ;


     //

     加入X LabelText


     string

     [] labels

     =


     new


     string

     [

     6

     ];


     for

      (

     int

      i

     =


     0

     ; i

     <

     dt.Rows.Count; i

     ++

     )
 {
 labels[i]

     =

      Convert.ToString(dt.Rows[i][

     "

     姓名

     "

     ]);
 }
 myPane.XAxis.Scale.TextLabels

     =

      labels;

     //

     X軸的說明文字


      myPane.XAxis.Type

     =

      AxisType.Text;

     //

     X軸類型


     //

     重新計算目前數據範圍


      zgc.AxisChange();


     //

      expand the range of the Y axis slightly to accommodate the labels


     //

      myPane.YAxis.Scale.Max += myPane.YAxis.Scale.MajorStep;


     //

      YAxis最大值


      myPane.YAxis.Scale.Max

     =


     110

     ;


     //

      Create TextObj's to provide labels for each bar


     //

      在bar上顯示數值


      BarItem.CreateBarLabels(myPane,

     false

     ,

     "

     f0

     "

     );


     //

     顯示格點


      myPane.YAxis.MajorGrid.IsVisible

     =


     true

     ;
 myPane.XAxis.MajorGrid.IsVisible

     =


     true

     ;
}