1. 测试代码
package spark.examples.streaming

import org.apache.spark.SparkConf
import org.apache.spark.streaming.StreamingContext._
import org.apache.spark.streaming._

object NetCatStreamingWordCountDelay {
  def main(args: Array[String]) {
    val conf = new SparkConf().setAppName("NetCatStreamingWordCountDelay")
    conf.setMaster("local[3]")
    //Receive data every second
    val ssc = new StreamingContext(conf, Seconds(1))
    val lines = ssc.socketTextStream("192.168.26.140", 9999)
    //Each processing should take about 4 seconds.
    lines.foreachRDD(rdd => {
      println("This is the output even if rdd is empty")
      Thread.sleep(4 * 1000)
    })
    ssc.start()
    ssc.awaitTermination()
  }
}
上面的测试代码:
1. 时间间隔设置为1秒,也就是说,每隔1秒钟,Spark Streaming将创建一个RDD
2. 处理的速度是4秒,也就是,处理速度滞后于数据的读取速度
2. UI展现
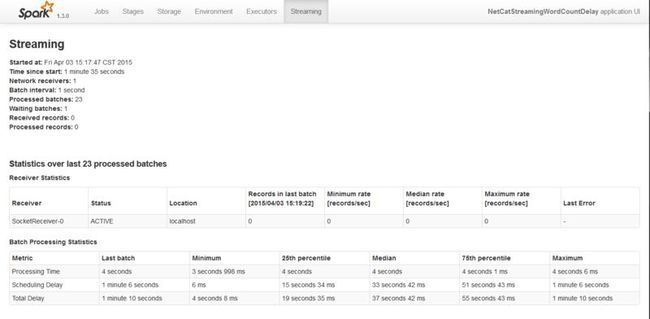
如何解读上面的统计信息:
1. Spark Streaming一共运行了1分钟35秒=95秒
2. 一共处理了23个batch,每隔处理的时间4秒多点,因为23个batch总耗时是92秒
3. batch的时间间隔是1秒
4. Waiting batches为什么是1?应该是95/1-23=72个才对
I copied the following from the spark streaming UI, I don't know why the Waiting batches is 1, my understanding is that it should be 72.
Following is my understanding:
1. Total time is 1minute 35 seconds=95 seconds
2. Batch interval is 1 second, so, 95 batches are generated in 95 seconds.
3. Processed batches are 23(Correct, because in my processing code, it does nothing but sleep 4 seconds)
4. Then the waiting batches should be 95-23=72
Tathagata Das回复:Very good question! This is because the current code is written such that the ui considers a batch as waiting only when it has actually started being processed. Thats batched waiting in the job queue is not considered in the calculation. It is arguable that it may be more intuitive to count that in the waiting as well.
1. Processing Time指的是每个batch的耗时时间,统计的时间包括上一个batch的处理耗时,batch的最小耗时。以及25%,50%,75%时间段的耗时
2. Total Delay:1分10秒如何计算出来的?总共95秒,有23个batch出来完(23秒),那么总延时是95-23=72秒。
3. Scheduling Delay表示一个batch从入队到出队的延迟,上例中,最后一个batch的延时是1分6秒钟。会不断的累加。
3. Spark官方文档解释
Beyond Spark’s monitoring capabilities, there are additional capabilities specific to Spark Streaming. When a StreamingContext is used, the Spark web UI shows an additional Streaming tab which shows statistics about running receivers (whether receivers are active, number of records received, receiver error, etc.) and completed batches (batch processing times, queueing delays, etc.). This can be used to monitor the progress of the streaming application.
The following two metrics in web UI are particularly important:
- Processing Time - The time to process each batch of data.
- Scheduling Delay - the time a batch waits in a queue for the processing of previous batches to finish.
If the batch processing time is consistently more than the batch interval and/or the queueing delay keeps increasing, then it indicates the system is not able to process the batches as fast they are being generated and falling behind. In that case, consider reducing the batch processing time.
The progress of a Spark Streaming program can also be monitored using the StreamingListener interface, which allows you to get receiver status and processing times. Note that this is a developer API and it is likely to be improved upon (i.e., more information reported) in the future