How-to: 使用 highcharts + MySQL 构建自己的简易网站监控系统
出自我的个人博客: http://www.suzf.net/thread-1001-345.html 
Highcharts 是一个用纯JavaScript编写的一个图表库。
Highcharts 能够很简单便捷的在web网站或是web应用程序添加有交互性的图表
Highcharts 免费提供给个人学习、个人网站和非商业用途使用。
HighCharts 特性
兼容性 �C 支持所有主流浏览器和移动平台(android、iOS等)。
多设备 �C 支持多种设备,如手持设备 iPhone/iPad、平板等。
免费使用 �C 开源免费。
轻量 �C highcharts.js 内核库大小只有 35KB 左右。
配置简单 �C 使用 json 格式配置
动态 �C 可以在图表生成后修改。
多维 �C 支持多维图表
配置提示工具 �C 鼠标移动到图表的某一点上有提示信息。
时间轴 �C 可以精确到毫秒。
导出 �C 表格可导出为 PDF/ PNG/ JPG / SVG 格式
输出 �C 网页输出图表。
可变焦 �C 选中图表部分放大,近距离观察图表;
外部数据 �C 从服务器载入动态数据。
文字旋转 �C 支持在任意方向的标签旋转。
支持的图表类型
HighCharts支持的图表类型:
| 序号 | 图表类型 |
|---|---|
| 1 | 曲线图 |
| 2 | 区域图 |
| 3 | 饼图 |
| 4 | 散点图 |
| 5 | 气泡图 |
| 6 | 动态图表 |
| 7 | 组合图表 |
| 8 | 3D 图 |
| 9 | 测量图 |
| 10 | 热点图 |
| 11 | 树状图(Treemap) |
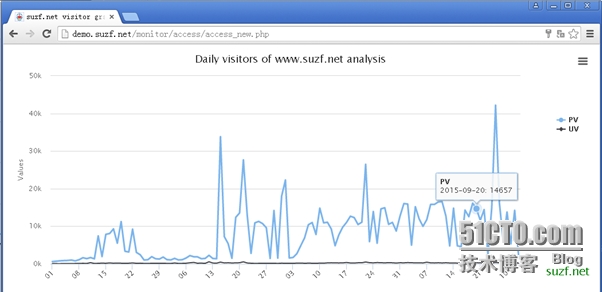
好了 接下来我给大家介绍一个简单地例子:
highcharts + mysql 展示网站 PV&UV 访问情况。
因为只是业余拿来耍耍,难免有纰漏。欢迎大家指出。
提供部分主要代码
创建数据库及用户
mysql> use highcharts;
Database changed
mysql> show create table access_log\G
*************************** 1. row ***************************
       Table: access_log
Create Table: CREATE TABLE `access_log` (
  `id` int(11) NOT NULL AUTO_INCREMENT,
  `name` varchar(100) DEFAULT NULL,
  `date` date DEFAULT NULL,
  `pv` decimal(10,0) DEFAULT NULL,
  `uv` decimal(10,0) DEFAULT NULL,
  PRIMARY KEY (`id`)
) ENGINE=InnoDB AUTO_INCREMENT=124 DEFAULT CHARSET=latin1
1 row in set (0.00 sec)
展示页面 access_new.php
<!DOCTYPE HTML>
<html>
  <head>
    <meta http-equiv="Content-Type" content="text/html; charset=utf-8">
    <title>suzf.net visitor graph</title>
    <script type="text/javascript" src="/js/jquery-1.8.3.min.js"></script>
    <script type="text/javascript">
      $(document).ready(function() {
        var options = {
            chart: {
              renderTo: 'container',
              type: 'line',
              marginRight: 130,
              marginBottom: 25
            },
            title: {
              text: 'Daily visitors of www.suzf.net  analysis',
              x: -20
            },
            subtitle: {
              text: '',
              x: -20
            },
            xAxis: {
              tickInterval: 7,
              tickPixelInterval: 50,
              title: {
                text: 'timeline',
              },
              categories: []
            },
            yAxis: {
              min: 0,
              title: {
                text: 'Values'
              },
              plotLines: [{
                value: 0,
                width: 1,
                color: '#808080'
              }]
            },
            credits:{
              enabled:true,
              text:'suzf.net',
              href:'http://www.suzf.net',
              style: {
                cursor: 'pointer',
                color: 'green',
                fontSize: '20px'
              }
            },
            tooltip: {
               formatter: function() {
                 return '<b>'+ this.series.name +'</b><br/>'+
                               this.x +': '+ this.y;
               }
            },
            legend: {
              layout: 'vertical',
                align: 'right',
                verticalAlign: 'top',
                x: -10,
                y: 100,
                borderWidth: 0
            },
                series: []
          }

          $.getJSON("data_access.php", function(json) {
              options.xAxis.categories = json[0]['data'];
              options.series[0] = json[1];
              options.series[1] = json[2];
              chart = new Highcharts.Chart(options);
          });
        });
        </script>
        <script src="/js/highcharts.js"></script>
        <script src="/js/exporting.js"></script>
    </head>
  <body>
    <div id="container" style="min-width: 400px; height: 400px; margin: 0 auto"></div>
  </body>
</html>
将结果格式化成JSON 格式 传给前端 data_access.php
<?php
$con = mysql_connect("hostname","highcharts","password");

if (!$con) {
  die('Could not connect: ' . mysql_error());
}

mysql_select_db("highcharts", $con);

$sth = mysql_query("SELECT date FROM access_log");
$date = array();
$date['name'] = 'Date';
while($r = mysql_fetch_array($sth)) {
    $date['data'][] = $r['date'];
}

$sth = mysql_query("SELECT pv FROM access_log");
$pv = array();
$pv['name'] = 'PV';
while($rr = mysql_fetch_assoc($sth)) {
    $pv['data'][] = $rr['pv'];
}

$sth = mysql_query("SELECT uv FROM access_log");
$uv = array();
$uv['name'] = 'UV';
while($rr = mysql_fetch_assoc($sth)) {
    $uv['data'][] = $rr['uv'];
}

$result = array();
array_push($result,$date);
array_push($result,$pv);
array_push($result,$uv);


print json_encode($result, JSON_NUMERIC_CHECK);

mysql_close($con);
?>
下面我们来看一下效果吧
