【OpenCV】绘制直方图
和这一篇《数字图像直方图》内容是一样的,只是使用Mat格式实现~
绘制灰色直方图
//绘制灰度直方图
int main(  )
{
	Mat src,gray;
	src=imread("baboon.jpg");
	cvtColor(src,gray,CV_RGB2GRAY);
	int bins = 256;
	int hist_size[] = {bins};
	float range[] = { 0, 256 };
	const float* ranges[] = { range};
	MatND hist;
	int channels[] = {0};

	calcHist( &gray, 1, channels, Mat(), // do not use mask
		hist, 1, hist_size, ranges,
		true, // the histogram is uniform
		false );

	double max_val;
	minMaxLoc(hist, 0, &max_val, 0, 0);
	int scale = 2;
	int hist_height=256;
	Mat hist_img = Mat::zeros(hist_height,bins*scale, CV_8UC3);
	for(int i=0;i<bins;i++)
	{
		float bin_val = hist.at<float>(i);
		int intensity = cvRound(bin_val*hist_height/max_val);  //要绘制的高度
		rectangle(hist_img,Point(i*scale,hist_height-1),
			Point((i+1)*scale - 1, hist_height - intensity),
			CV_RGB(255,255,255));
	}
	imshow( "Source", src );
	imshow( "Gray Histogram", hist_img );
	waitKey(10000000000);
	return 0;
}
实验结果:
绘制RGB三色直方图
//绘制RGB三色分量直方图
int main(  )
{
	Mat src;
	src=imread("baboon.jpg");
	int bins = 256;
	int hist_size[] = {bins};
	float range[] = { 0, 256 };
	const float* ranges[] = { range};
	MatND hist_r,hist_g,hist_b;
	int channels_r[] = {0};

	calcHist( &src, 1, channels_r, Mat(), // do not use mask
		hist_r, 1, hist_size, ranges,
		true, // the histogram is uniform
		false );

	int channels_g[] = {1};
	calcHist( &src, 1, channels_g, Mat(), // do not use mask
		hist_g, 1, hist_size, ranges,
		true, // the histogram is uniform
		false );

	int channels_b[] = {2};
	calcHist( &src, 1, channels_b, Mat(), // do not use mask
		hist_b, 1, hist_size, ranges,
		true, // the histogram is uniform
		false );
	double max_val_r,max_val_g,max_val_b;
	minMaxLoc(hist_r, 0, &max_val_r, 0, 0);
	minMaxLoc(hist_g, 0, &max_val_g, 0, 0);
	minMaxLoc(hist_b, 0, &max_val_b, 0, 0);
	int scale = 1;
	int hist_height=256;
	Mat hist_img = Mat::zeros(hist_height,bins*3, CV_8UC3);
	for(int i=0;i<bins;i++)
	{
		float bin_val_r = hist_r.at<float>(i);
		float bin_val_g = hist_g.at<float>(i);
		float bin_val_b = hist_b.at<float>(i);
		int intensity_r = cvRound(bin_val_r*hist_height/max_val_r);  //要绘制的高度
		int intensity_g = cvRound(bin_val_g*hist_height/max_val_g);  //要绘制的高度
		int intensity_b = cvRound(bin_val_b*hist_height/max_val_b);  //要绘制的高度
		rectangle(hist_img,Point(i*scale,hist_height-1),
			Point((i+1)*scale - 1, hist_height - intensity_r),
			CV_RGB(255,0,0));

		rectangle(hist_img,Point((i+bins)*scale,hist_height-1),
			Point((i+bins+1)*scale - 1, hist_height - intensity_g),
			CV_RGB(0,255,0));

		rectangle(hist_img,Point((i+bins*2)*scale,hist_height-1),
			Point((i+bins*2+1)*scale - 1, hist_height - intensity_b),
			CV_RGB(0,0,255));

	}
	imshow( "Source", src );
	imshow( "RGB Histogram", hist_img );
	waitKey(10000000000);
	return 0;
}
实验结果:
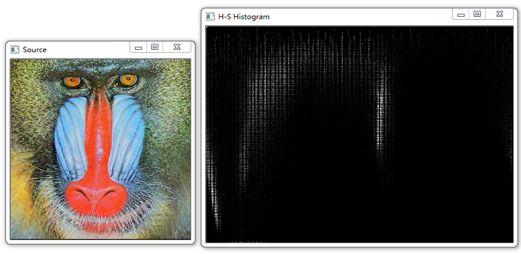
绘制二维直方图
//绘制H-S二维直方图
int main( )
{
	Mat src,hsv;
	src=imread("baboon.jpg");
	cvtColor(src, hsv, CV_BGR2HSV);
	// Quantize the hue to 30 levels
	// and the saturation to 32 levels
	int hbins = 256, sbins = 180;
	int histSize[] = {hbins, sbins};
	// hue varies from 0 to 179, see cvtColor
	float hranges[] = { 0, 180 };
	// saturation varies from 0 (black-gray-white) to
	// 255 (pure spectrum color)
	float sranges[] = { 0, 256 };
	const float* ranges[] = { hranges, sranges };
	MatND hist;
	// we compute the histogram from the 0-th and 1-st channels
	int channels[] = {0, 1};
	calcHist( &hsv, 1, channels, Mat(), // do not use mask
		hist, 2, histSize, ranges,
		true, // the histogram is uniform
		false );
	double maxVal=0;
	minMaxLoc(hist, 0, &maxVal, 0, 0);
	int scale = 2;
	Mat histImg = Mat::zeros(sbins*scale, hbins*scale, CV_8UC3);
	for( int h = 0; h < hbins; h++ )
		for( int s = 0; s < sbins; s++ )
		{
			float binVal = hist.at<float>(h, s);
			int intensity = cvRound(binVal*255/maxVal);
			rectangle( histImg, Point(h*scale, s*scale),
				Point( (h+1)*scale - 1, (s+1)*scale - 1),
				Scalar::all(intensity),
				CV_FILLED );
		}
	namedWindow( "Source", 1 );
	imshow( "Source", src );
	namedWindow( "H-S Histogram", 1 );
	imshow( "H-S Histogram", histImg );
	waitKey(10000000000);
	return 0;
}
实验结果:


