一起啃PRML - 1.1 Example: Polynomial Curve Fitting
一起啃PRML - 1.1 Example: Polynomial Curve Fitting
@copyright 转载请注明出处 http://www.cnblogs.com/chxer/
前言:真是太糟糕了,本地的公式和图片粘上来全都喂汪了。。。
We begin by introducing a simple regression problem, 用一个例子穿起这些零碎的知识点。
回顾最前面的Mathematical Notation: A superscript T denotes the transpose of a matrix or vector, so that xT will be a row vector. Uppercase bold roman letters, such as M, denote matrices. The notation (w1, . . . , wM ) denotes a row vector with M elements, while the corresponding column vector is written as w = (w1,...,wM)T. 上标T表示了一个矩阵或者是一个向量。
@define 我们用x ≡ (x1 , . . . , xN )T 表示我们的training set,t ≡ (t1, . . . , tN )T表示对应值。
The input data set x in this chart was generated by choosing values of Xn, for n = 1,...,N, spaced uniformly in range [0,1], and the target data set t was obtained by first computing the corresponding values of the function sin(2πx) and then adding a small level of random noise.
这些点是由 sin(2πx)以及一些噪声得出的。
那么,当我们有了这些点的时候,我们需要做的就是根据这些点的情况找到他们之间潜在的规律。一方面是统计归纳,另一方面也要克服噪声的干扰。也就是说,当我们获取下一个新的x时,我们有能力预测它的corresponding t.
为了curve fitting. 我们通常需要使用polynomial function.
@define polynomial function
Ps.有一大堆公式的文档真的慎用pages
对于线性模型(linear models)在后续章节还会涉及。
当我们在不断学习的过程中,我们的coefficients将会被不断地完善并确定。
那么怎么样算是一个比较“好”的拟合结果呢?我们引入误差函数(error function)来衡量我们的模型。
@define error function
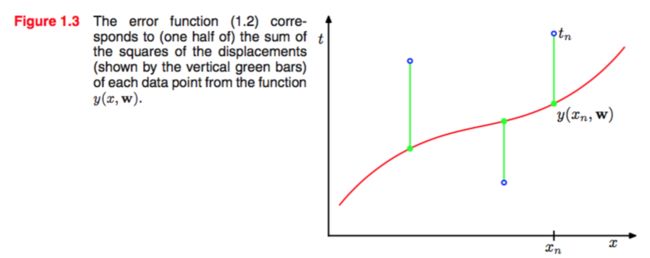
可以看出,误差函数直接反映了现在的模型和训练模型的差距。误差函数永远非负,当且仅当现有模型完全成功拟合(即exactly through each training data point )时取到极值0.我们就是要minimum这个error function.
最前面二分之一的系数是待会方便画图吧,作者也没有说清楚。要是知道详情的还请赐教。。。
如上图对error function的geometrical interpretation.
我们可以通过选择一个合适的w来minimum the E(w)。
这里就涉及到了model comparison & model selection.
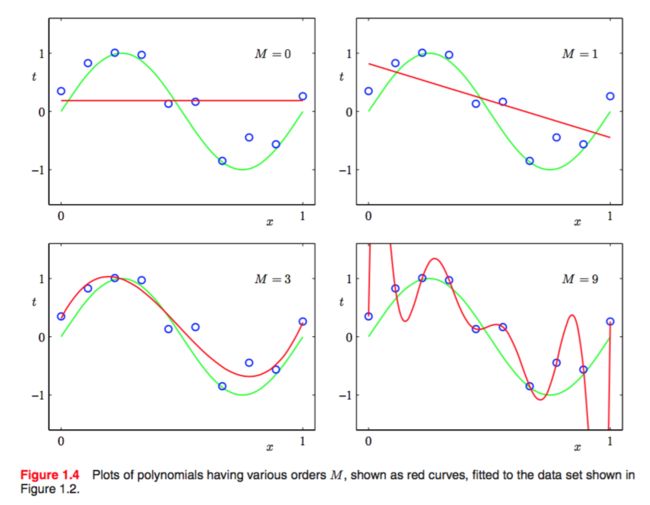
不妨先看看对于figure2中的function,w取到0,1,3,9时候的拟合结果:
可以看出,常数函数和线性函数不能很好地反应正弦函数的走势,九次函数精确地穿过了每一个点,它的E(w)=0,但是结果却十分糟糕,这种现象称为过拟合(over fitting).
同时,我们看到三次函数的效果是最好的,基本反映了正弦函数的走势。
我们可以通过test set来看看这个m的取值是不是好的。我们在training的过程中使用了E(w) function, 那么在测试test set的时候我们也可以使用它。
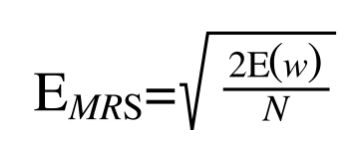
为了体现出测试集大小对于误差的影响,我们通常使用更为方便的均方根误差(root-mean-square)
@define (RMS) error function
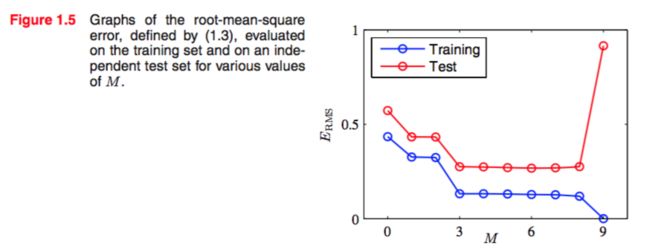
可以看看均方根误差和我们的E(w)关于M的图像:
可以看出,M在3 - 8之间的取值是非常合理的,而9得MRS error则非常糟糕,对于猜测几乎起不到作用。可以说exhibits wild oscillations…
但是这非常paradoxical,一方面我们在前面提到我们要minimum the E(w) as possible as we can,另一方面 E(w)=0 的“理论最好结果”在测试中却取得了最差的成绩。WHY?
Furthermore, we might suppose that the best predictor of new data would be the function sin(2πx) from which the data was generated (and we shall see later that this is indeed the case). We know that a power series expansion of the function sin(2πx) contains terms of all orders, so we might expect that results should improve monotonically as we increase M.
也就是说,追根溯源我们要做的是creat the best predictor of new data. 那么我们也就希望我们在寻找这个best predictor 的时候是一点点接近的,换句话说,我们希望一个monotonically的过程,不断地improve the model.
比如在我们的例子中,我们的w不断地长,当到达9的时候,我们发现ERM开始下降,于是我们就不选取9这个点。这样,最优的解就是3 - 8. 这种想法可以基本保证我们的模型不会over fitting.
那么到底为什么随着M到达一个值后就会over-fitting呢?
作者是这么解释的:我们不妨先看一看这个polynomial 的 coefficients:
可以看到,随着M的不断增大,polynomial的coefficients越来越复杂,都出现了百万级别的大数,可见,随着M的增大,coefficients的增多,我们的polynomial越来越趋向于被噪声所干扰而越来越复杂。相应地,当M很小时,coefficients数量少并且非常简单,这时候就无法体现出这个function的特性。所以综合来看,M的选取是有技巧的,既不能过大导致over-fitting,又不能过少导致under-fitting(欠拟合)。
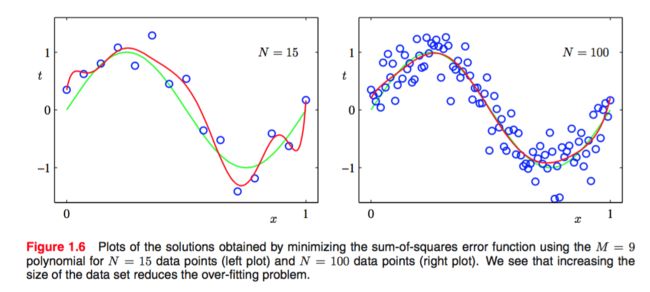
不过同时,M相同,如果数据量也就是N足够大的时候,通常over-fitting表现的不明显,如下两图:
也就是说,对于不同的数据量我们要选择适当的模型强度来比较好的拟合。
不过呢,One rough heuristic that is sometimes advocated is that the number of data points should be no less than some multiple (say 5 or 10) of the number of adaptive parameters in the model. However, as we shall see in Chapter 3, the number of parameters is not necessarily the most appropriate measure of model complexity.
我在《人工智能:复杂问题求解》上看到了另一种解释,我觉得也很好,大概就是当你的模型强度太大的时候,模型更趋向于关注个体的变化;当模型强度较低时,模型更趋向于关注整体的走势。个体的变化总是受噪声干扰,走势的变化总是不精准。要么降低噪声以减少个体的不确定,要么增大数据量增加走势的准确性。如果这两个都到尽头了,那就选取一个很好的强度平衡这两个极端。
不过,学习了最大似然法(maximum likelihood)之后,over-fitting & under-fitting 似乎就不是什么问题了,所以不用特别纠结,有个感性的认识就差不多了。
那么如何简单的解决这个问题呢?事实上,通过Table 1.1我们可以看到,M越大是先影响了我们的coefficients,然后我们的coefficients再影响的我们的模型,所以如果能控制住coefficients的大小也就控制了模型。
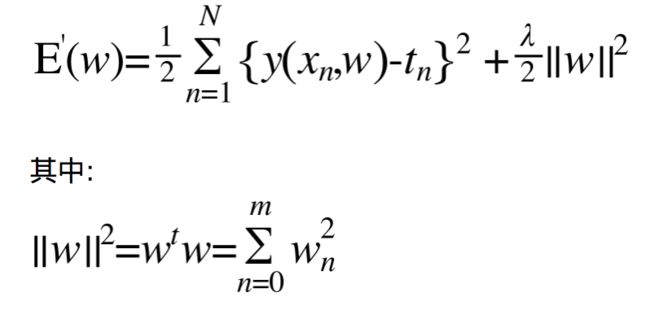
如何控制:可以通过一种简单的惩罚机制(Punishment mechanism)来直接控制模型的复杂度。当coefficients过大时我们就在E(w)上惩罚它,这样这个polynomial被选中的概率就大幅度下降。考虑到coefficients越大则模型可能越不合理,所以我们直接在E(w)后面加上(事实上是有系数的)coefficients的平方和就可以了:
这种方法在ANN里叫做权值衰减(weight decay).
我们再看一看此时polynomial’s coefficients:
确实, 对系数的影响是十分明显的。这个惩罚机制直接控制住了函数的复杂度。
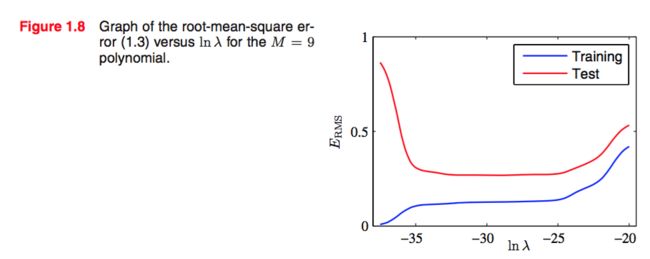
可以看到,一个合适的 也很好的控制了模型预测的能力。我们可以在validation set中确定这个参数。
这一章主要是从直观的角度来描述并解决pattern recognition problem.下一章将要讲述关于概率论的principled approach即原则性方法。


