opencv学习之(五)-直方图计算和绘制图像直方图
1 直方图
灰度直方图的定义
灰度直方图是灰度级的函数,描述图像中该灰度级的像素个数(或该灰度级像素出现的频率):其横坐标是灰度级,纵坐标表示图像中该灰度级出现的个数(频率)。
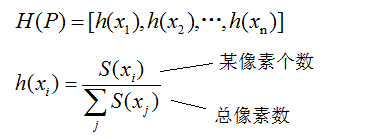
一维直方图的结构表示为
高维直方图可以理解为图像在每个维度上灰度级分布的直方图。常见的是二维直方图。如红-蓝直方图的两个分量分别表示红光图像的灰度值和蓝光图像灰度值的函数。其图像坐标(Dr,Db)处对应在红光图像中具有灰度级Dr同时在蓝光图像中具有灰度级Db的像素个数。这是基于多光谱——每个像素有多个变量——的数字图像,二维中对应每个像素统计个变量。
简单的说,直方图就是对数据进行统计,将统计值组织到一系列事先定义好的bin中。bin的数值是从数据中计算出的特征的统计量,这些数据可以是诸如梯度,方向,色彩或者任何其他特征。无论如何,直方图获得的是数据分布的统计图。通常直方图的数据要低于原始数据。由于原始数据点可以表征任何事情,所以直方图实际上是一个方便表示图像特征的手段。
2 灰度直方图的计算
// Histogram.cpp : 定义控制台应用程序的入口点。
//

/***********************************************************************
 * OpenCV 2.4.4 测试例程
 * 杜健健 提供
 ***********************************************************************/

#include "stdafx.h"
#include <opencv2/core/core.hpp>
#include <opencv2/imgproc/imgproc.hpp>
#include <opencv2/highgui/highgui.hpp>
#include <iostream>

using namespace std;
using namespace cv;

//参数:Gray_img --输入的灰度图像
//      hist 计算后输出的直方图
void myCal_Hist(Mat Gray_img,MatND hist){

	int bins = 256;
    int hist_size[] = {bins};
    float range[] = { 0, 256 };
    const float* ranges[] = { range};

	int channels[] = {0};
    //计算直方图
    calcHist( &Gray_img, 1, channels, Mat(), // do not use mask
        hist, 1, hist_size, ranges,
        true, // the histogram is uniform
        false );

	//绘制直方图图像
	int hist_height=256;
	//int bins = 256;
	double max_val;  //直方图的最大值
	int scale = 2;   //直方图的宽度
    minMaxLoc(hist, 0, &max_val, 0, 0); //计算直方图最大值

    Mat hist_img = Mat::zeros(hist_height,bins*scale, CV_8UC3); //创建一个直方图图像并初始化为0

	cout<<"max_val = "<<max_val<<endl;
    //在直方图图像中写入直方图数据
    for(int i=0;i<bins;i++)
    {
        float bin_val = hist.at<float>(i); //	第i灰度级上的数
        int intensity = cvRound(bin_val*hist_height/max_val);  //要绘制的高度
		//填充第i灰度级的数据
        rectangle(hist_img,Point(i*scale,hist_height-1),
            Point((i+1)*scale - 1, hist_height - intensity),
            CV_RGB(255,255,255));
    }

    imshow( "Gray Histogram2", hist_img );
}

//根据直方图数据绘制并显示直方图图像
void myShow_Histogram(MatND &hist,int scale){

	int hist_height=256;
	int bins = 256;
	double max_val;

    minMaxLoc(hist, 0, &max_val, 0, 0);

    Mat hist_img = Mat::zeros(hist_height,bins*scale, CV_8UC3);

	cout<<"max_val = "<<max_val<<endl;
    for(int i=0;i<bins;i++)
    {
        float bin_val = hist.at<float>(i); //


        int intensity = cvRound(bin_val*hist_height/max_val);  //要绘制的高度

        rectangle(hist_img,Point(i*scale,hist_height-1),
            Point((i+1)*scale - 1, hist_height - intensity),
            CV_RGB(255,255,255));
    }

    imshow( "Gray Histogram2", hist_img );
}

int _tmain(int argc, _TCHAR* argv[])
{

	Mat src,gray,src2,gray2;
    //src=imread("D://input//buti.jpg");
	src = imread("D://input//yalefaces//01//s1.bmp");
    cvtColor(src,gray,CV_RGB2GRAY);  //转换成灰度图

	src2 = imread("D://input//yalefaces//02//s1.bmp");
    cvtColor(src2,gray2,CV_RGB2GRAY);  //转换成灰度图
    MatND hist2;

    imshow( "Source", src );
    //imshow( "Gray Histogram", hist_img );
    imshow("Source2",src2);

	myCal_Hist(gray2,hist2);
	//myShow_Histogram(hist2,5);


    waitKey();
    return 0;

}
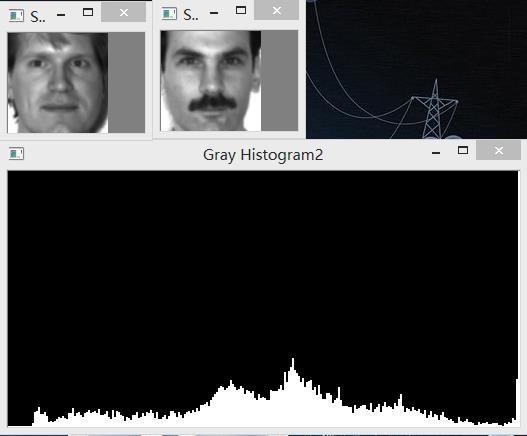
3 示例展示
4 参考
http://blog.csdn.net/xiaowei_cqu/article/details/7600666
http://blog.csdn.net/xiaowei_cqu/article/details/8833799#comments

