从PCA到Kernel PCA(Python)
PCA不进行分类的动作,而只做做数据预处理,将样本变换到一个容易分类(向最大化方差的方向,principal component axes,投影)的更低维的新的特征空间中。Kernel PCA比PCA多了一步,也即先升维(RBF包括多项式核均是升高到无穷维)再进行投影的动作,因为有些非线性可分的数据集只有在升维的视角下才线性可分。
PCA
- 均值化的数据:
∑ixi=0
# python
>>> X-np.mean(X, 0)
                # 一个二维矩阵减去一维向量?对,
                # 这里用到的技术是numpy中broadcasting(广播机制)
样本协方差矩阵(sample-covariance matrix C )
C=1N∑ixixTi=1NXXT
其中, X 的每一列表示一个样本(特征向量)特征分解
C=UΛUT=∑αλαuαuTαprojection or transform
the projected data are de-correlated in this new axis.
- 重构
yi=UTkxi⇓Ukyi=UkUTkxi=xi
import pandas as pd
import numpy as np

df = pd.read_csv('https://archive.ics.uci.edu/ml/machine-learning-databases/wine/wine.data', header=None)
X, y = df.values[:, 1:], df.values[:, 0]

# step 1
X -= X.mean(0)

## step 2
N = X.shape[0]
C = X.T.dot(X)/N

## step 3
Lambda, Q = np.linalg.eig(C)

## step 4
k = 3
eigen_pairs = [(Lambda[i], Q[:, i]) for i in range(len(Lambda))]
eigen_pairs = sorted(eigen_pairs, reverse=True, key=lambda k: k[0])
W = np.column_stack((eigen_pairs[i][1] for i in range(k=3)))

## step 5
X_pca = X.dot(W)
Kernel PCA
以 Radial Basis Function(RBF) kernel PCA(不同的核,体现在代码上仅仅是一处细微的差别)为例进行说明:
- 计算核矩阵(相似度矩阵) K
这是最为常见的RBF(Rational Basis Function)核函数,也有多项式核:
和 sigmoid型(hyperbolic tangent)核:
其矩阵形式也即:
- center the K
其中 1n 是 n×n 的元素值全为 1n 矩阵。
- 对 K′ 进行特征值分解,获得对应于前 k 个特征值的特征向量。与标准PCA算法不同的是,这里获得特征向量不再是 principal component axes,而已经是全部样本在这些轴上的投影了,也即是我们所需的进行降维后的数据了。
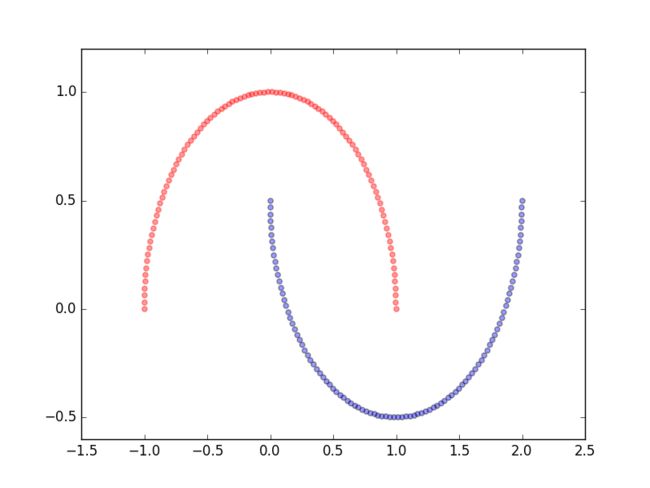
这里为了验证核机制的性能,我们在如下的数据集上进行测试:
from sklearn.datasets import make_moons

X, y = make_moons(n_samples=200, random_state=123)
plt.scatter(X[y==0, 0], X[y==0, 1], colors='r', marker='^', alpha=.4)
plt.scatter(X[y==1, 0], X[y==1, 1], colors='b', marker='o', alpha=.4)
from scipy.spatial.distance import pdist, squareform

def rbf_kpca(X, gamma, k):
    sq_dist = pdist(X, metric='sqeuclidean')
                            # N = X.shape[0]
                            # sq_dist.shape = N*(N-1)/2
    mat_sq_dist = squareform(sq_dist)
                            # mat_sq_dist.shape = (N, N)
    # step 1
    K = np.exp(-gamma*mat_sq_dist)

    # step 2
    N = X.shape[0]
    one_N = np.ones((N, N))/N
    K = K - one_N.dot(K) - K.dot(one_N) + one_N.dot(K).dot(one_N)

    # step 3
    Lambda, Q = np.linalg.eig(K)
    eigen_pairs = [(Lambda[i], Q[:, i]) for i in range(len(Lambda))]
    eigen_pairs = sorted(eigen_pairs, reverse=True, key=lambda k: k[0])
    return np.column_stack((eigen_pairs[i][1] for i in range(k)))
调用:
X_kpca = rbf_kpca(X, gamma=15, k=2)一个非线性可分的数据集
from sklearn.datasets import make_circles
X, y = make_circles(n_samples=1000, noise=.1, factor=.2, random_state=123)
plt.scatter(X[y==0, 0], X[y==0, 1], color='r', marker='^', alpha=.4)
plt.scatter(X[y==1, 0], X[y==1, 1], color='b', marker='o', alpha=.4)
plt.show()在这样的一个非线性可分的数据集,显然如何找到最大方差的方向都不可能使最后的数据集线性可分。接下来,我们探讨KPCA的核机制是如何工作的,使线性不可分的数据集变得线性可分,
应用kernel trick:
X_kpca = rbf_kpca(X, gamma=15, k=2)可视化:
fig, ax = plt.subplots(1, 2, figsize=(8, 4))

ax[0].scatter(X_kpca[y==0, 0], X_kpca[y==0, 1], color='r', marker='^', alpha=.4)
ax[0].scatter(X_kpca[y==1, 0], X_kpca[y==1, 1], color='b', marker='o', alpha=.4)

label_count = np.bincount(y)
                                # 统计各类别出现的次数
                                # label_count[0] = 500
                                # label_count[1] = 500
ax[1].scatter(X_kpca[y==0, 0], np.zeros(label_count[0]), color='r')
ax[1].scatter(X_kpca[y==1, 0], np.zeros(label_count[1]), color='b')
                                # y轴置零
                                # 投影到x轴
ax[1].set_ylim([-1, 1])
ax[0].set_xlabel('PC1')
ax[0].set_ylabel('PC2')
ax[1].set_xlabel('PC1')

plt.show()
PCA 与 KPCA 的另一点重要不同
不同在于对新数据、新样本(当然还是同一类型数据,比如测试样本之于训练样本)的转换方式不同;
标准PCA算法,转换矩阵(transformation matrix Wd×k )对应于训练样本的协方差矩阵的特征向量,使用 W 可继续作用于新的数据集, x′1×d⋅Wd×k 。而KPCA, K 的特征向量( Ka=λα 中的 α )即为变换后的样本。
对于新的样本,我们想要计算:
而特征向量 v=∑ia(i)ϕ(x(i)) ,则:
from scipy.spatial.distance import sqdist, squareform

def rbf_kpca(X, gamma, k):
    sq_dists = sqdist(X, metric='sqeuclidean')
    mat_sq_dists = squareform(sq_dists)
    K = np.exp(-gamma*mat_sq_dists)
    N = X.shape[0]
    one_N = np.ones((N, N))/N
    K = K-one_N.dot(K)-K.dot(one_N)+one_N.dot(K).dot(one_N)
    Lambda, Q = np.linalg.eigh(K)
    alphas = np.column_stack((Q[:, -i]for i in range(1, 1+k)))
    lambdas = [Lambda[-i] for i in range(1, k+1)]
    return alphas, lambdas

def proj_new(X_new, X, gamma, alphas, lambdas):
    k = np.exp(-gamma*np.sum((X-X_new)**2, 1))
    return k.dot(alphas/lambdas)
                                # alphas/lambdas,归一化后的alphas

X, y = make_moons(n_samples=100, random_state=123)
                                # 设置random_state,为了可重复性
alphas, lambdas = rbf_kpca(X, gamma=15, k=1)
X_new = X[25]
                    # 以当前样本的某一样本作为新的样本进行测试
X_proj = proj_new(X_new, X, gamma=15, alphas, lambdas)
print(alphas[25])
print(X_proj)
                    # [-0.07877284]
                    # [-0.07877284]