| This article explains how to set up ftrace and be able to understand how to trace functions. It should be useful for current kernel developers and device driver developers who want to debug kernel issues, and also for students who are keen to pursue a Linux systems programming career. |
本文探索如何建立ftrace并能理解如何跟踪函数。ftrace对于内核开发者和设备驱动开发者在调试内核问题的时候应该很有用。对于渴望探索Linux系统编程的爱好者来说,本文也值得学习一下。 |
| ftrace (Function Tracer) is the “Swiss army knife” of kernel tracing. It is a tracing mechanism built right into the Linux kernel. It has the capability to see exactly what is happening in the kernel, and debug it. ftrace is more than a mere function tracer, and has a wide variety of tracing abilities to debug and analyse a number of issues like latency, unexpected code paths, performance issues, etc. It can also be used as a good learning tool. ftrace was introduced in kernel 2.6.27 by Steven Rostedy and Ingo Molnar. It comes with its own ring buffer for storing trace data, and uses theGCC profiling mechanism. |
ftrace(函数跟踪)是内核跟踪的“瑞士军刀”。它是内建在Linux内核中的一种跟踪机制。它能深入内核去发现里面究竟发生了什么,并调试它。ftrace不只是一个函数跟踪工具,它的跟踪能力之强大,还能调试和分析诸如延迟、意外代码路径、性能问题等一大堆问题。它也是一种很好的学习工具。 ftrace是由Steven Rostedy和Ingo Molnar在内核2.6.27版本中引入的。它有自己存储跟踪数据的环形缓冲区,并使用GCC配置机制。 |
Prerequisites |
预备知识 |
| You need a 32-bit or 64-bit Linux machine with a kernel development environment, and as new a kernel as possible (the newer the kernel, the more the tracing options you get). I use a Fedora Core 13 (x86_64) machine in my environment, but any distribution would suffice. |
你需要一台有内核开发环境的32位或者64位Linux机器,内核版本越新越好(内核越新,跟踪选项就越多)。我是基于Fedora13的内核(X86_64)的机器,但其它版本也适用。 |
Setting up Ftrace |
设置ftrace |
| debugfs needs to be set up to run on the machine you want to use ftrace on. If you are unaware of how to set up debugfs, do refer to my debugfs article from last month. debugfs should have been mounted on /sys/kernel/debugfs, and if tracing is enabled, you should be able to see a directory called tracing under debugfs. If debugfs is not mounted, you can issue the following command: |
使用ftrace要求你的机器上配置有debugfs。如果你不知道怎么配置debugfs,请参阅我上个月的文章。 debugfs应该被挂载在/sys/kernel/debugfs,如果跟踪选项已启用,你应该能够在debugfs下面看到一个叫tracing的目录。如果没有挂载debugfs,请按以下操作: |
| # mount -t debugfs nodev /sys/kernel/debug |
| If you are unable to see the tracing subdirectory, you will need to enable tracing in the kernel configuration, and recompile it. Look for the following options to be enabled in the kernel configuration path (refer to Figure 1): Kernel Hacking -> Tracers
1. Kernel Function Tracer (FUNCTION_TRACER)
2. Kernel Function Graph Tracer (FUNCTION_GRAPH_TRACER)
3. Enable/disable ftrace dynamically (DYNAMIC_FTRACE)
4. Trace max stack (STACK_TRACER) |
如果你看不到tracing子目录的话,你应该在内核配置上启用相关选项,然后重编译内核。请在你的内核配置中找到如图1所示的选项,启用它们: Kernel Hacking -> Tracers
1. Kernel Function Tracer (FUNCTION_TRACER)
2. Kernel Function Graph Tracer (FUNCTION_GRAPH_TRACER)
3. Enable/disable ftrace dynamically (DYNAMIC_FTRACE)
4. Trace max stack (STACK_TRACER) |
| 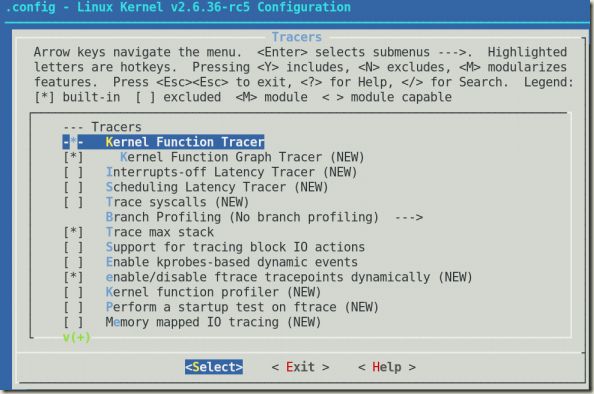
Figure 1: Kernel configurationoptions for tracing 图1:tracing的内核配置选项 |
| Depending on your architecture, a few more tracers can be enabled during compilation, as per requirements. The listed tracers are for debugging. Once the kernel compilation is complete, and you have booted to the new kernel, tracing can be initiated. |
根据你的架构,在选择上面的选项时,一些其他的选项根据依赖关系可能也会自动被启用。上面所列的选项主要是用于跟踪所用。内核编译完成之后,你只需要重启机器,tracing功能就可以用了。 |
Tracing |
跟踪 |
| Files in the tracing directory (/sys/kernel/debug/tracing) control the tracing ability (refer to Figure 2 for a list of files). A few files could be different, depending upon what tracers you selected during kernel configuration. You can obtain information on these files from the <kernel source>/Documentation/tracing directory. |
tracing目录(/sys/kernel/debug/tracing)中的文件(如图2所示)控制着跟踪的能力。根据你在内核配置时的选项的不同,这里列的文件可能稍有差异。你可以在内核源代码目录下/Documentation/trace[1]目录中找到这些文件的信息。 |
| 
Figure 2: Tracing files 图2:用于跟踪的文件 |
| Let’s explore a few of the important ones: ● available_tracers: This shows what tracers are compiled to trace the system.
● current_tracer: Displays what tracer is currently enabled. Can be changed by echoing a new tracer into it.
● tracing_enabled: Lets you enable or disable the current tracing.
● trace: Actual trace output.
● set_ftrace_pid: Sets the PID of the process for which trace needs to be performed. To find out the available tracers, just cat the available_tracers file. Tracers in the space-separated output include: nop (not a tracer, this is set by default); function (function tracer); function_graph (function graph tracer), etc: |
让我们看看里面几个重要的文件: ● available_tracers: 这表示哪些被编译里系统的跟踪器。
● current_tracer: 这表示当前启用的哪个跟踪器。可以通过echo向表输入一个新的跟踪器来改变相应值。
● tracing_enabled: 让你可以启用或者禁用当前跟踪功能
● trace: 实际地的跟踪输出。
● set_ftrace_pid: 设置跟踪所作用的进程的PID。 要找到哪些跟踪器可用,你可以对available_tracers文件执行cat操作。与输出空间分离的跟踪器有:nop(它不是一个跟踪器,是默认设置的一个值)、函数(函数跟踪器)、函数图(函数图跟踪器),等等,如下所示: |
| # cat available_tracers blk function_graph mmiotrace wakeup_rt wakeup irqsoff function sched_switch nop |
| Once you identify the tracer that you want to use, enable it (ftrace takes only one tracer at a time): |
当你知道你需要使用哪个跟踪器后,启用它(ftrace每次只能打开一个跟踪器): |
| # cat current_tracer ##to see what tracer is currently in use. # echo function > current_tracer ##select a particular tracer. # cat current_tracer ##check whether we got what we wanted. |
# cat current_tracer ##查看当前在用哪个跟踪器。 # echo function > current_tracer ##选择一个特定的跟踪器。 # cat current_tracer ##检查是否是你所设置的跟踪器。 |
| To start tracing, use the following commands: |
使用下面的命令可以开始跟踪: |
| # echo 1 > tracing_enabled ##initiate tracing # cat trace > /tmp/trace.txt ##save the contents of the trace to a temporary file. # echo 0 > tracing_enabled ##disable tracing # cat /tmp/trace.txt ##to see the output of the trace file. |
# echo 1 > tracing_enabled ##初始化跟踪。 # cat trace > /tmp/trace.txt ##将跟踪文件保存到一个临时文件。 # echo 0 > tracing_enabled ##禁用跟踪功能 # cat /tmp/trace.txt ##查看trace文件的输出。 |
| The trace output is now in the trace.txt file. A sample output of a function trace obtained with the above commands is shown in Figure 3. |
现在trace文件的输入在trace.txt文件中。通过上面操作所得到的函数跟踪的一个示例输出如图3所示。 |
| 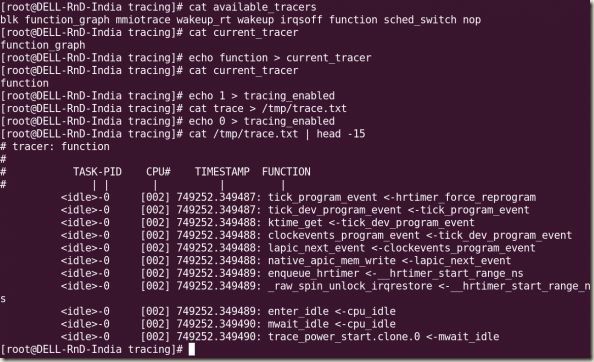
Figure 3: Sample trace output 图3:示例跟踪输出 |
| 本文英文源文http://www.linuxforu.com/2010/11/kernel-tracing-with-ftrace-part-1/,现附上与之相关的后续文章。 |
| Let’s begin with tracer options. The output of the tracing can be controlled by a file called trace_options. Various fields can be enabled and disabled by updating options in the file /sys/kernel/debug/tracing/trace_options. A sample of trace_options can be viewed in Figure 1. |
让我们从tracer的选项开始。tracing的输入可以由一个叫trace_options的文件控制。可以通过更新/sys/kernel/debug/tracing/trace_options文件的选项来启用或者禁用各种域。trace_options的一个示例如图1所示。 |
| 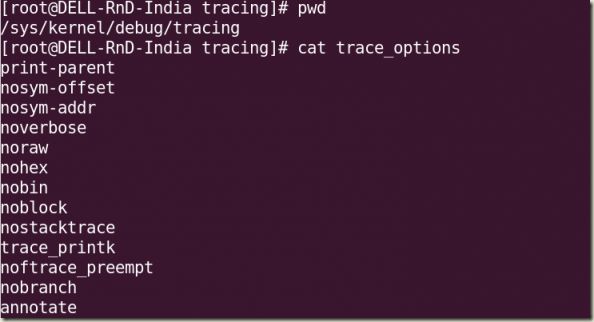
Figure 1: Trace options 图1:Trace选项 |
| To disable a tracing option, a “no” keyword needs to be added to the start of the line. For example, echo notrace_printk > trace_options. (Remember not to have a space between no and the option.) To enable a trace again, you could use, for instance, echo trace_printk > trace_options. |
要禁用一个跟踪选项,只需要在相应行首加一个“no”即可。比如,echo notrace_printk > trace_options。(no和选项之间没有空格。)要再次启用一个跟踪选项,你可以这样:echo trace_printk > trace_options。 |
ftrace for a specific process |
ftrace之特殊进程 |
| ftrace allows you to perform tracing even for a specific process. In the /sys/kernel/debug/tracing directory, the file set_ftrace_pid needs to be updated with the PID of the process you want to be traced. The traceprocess.sh sample script below shows how to capture the PID on-the-go, and enable tracing. |
ftrace允许你对一个特殊的进程进行跟踪。在/sys/kernel/debug/tracing目录下,文件set_ftrace_pid的值要更新为你想跟踪的进程的PID。以下traceprocess.sh示例脚本向你展示了如何抓取当前运行的进程的PID,并进行相应跟踪。 |
|
|
| You can refine it with your own innovations. Run it with the command whose process you want to trace as the argument, as shown in Figure 2, where we traced the ls command. |
你也可以根据需要改进上面的脚本。在命令行中运行上面的脚本,并以你想跟踪的进程名作为参数,如图2中跟踪ls命令所示。 |
| 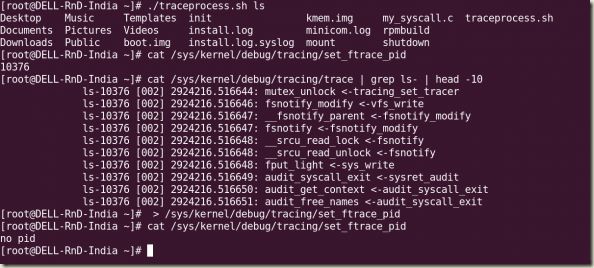
Figure 2: Executing traceprocess.sh and viewing trace output 图2:执行traceprocess.sh并查看跟踪输出 |
| Once tracing is complete, you need to clear the set_ftrace_pid file, for which you can use the following command: |
当跟踪完成后,你需要清除set_ftrace_pid文件,请用如下命令: |
| :> set_ftrace_pid |
Function graph tracer |
函数图跟踪器 |
| The function graph tracer tracks the entry and exit of a function, and is quite useful to track its execution time. Functions with a duration of over 10 microseconds are marked with a “+”, and those over 100 microseconds with “!”. To enable the function graph tracer, use echo function_graph > current_tracer. The sample output is as shown in Figure 3. |
函数图跟踪器对函数的进入与退出进行跟踪,这对于跟踪它的执行时间很有用。函数执行时间超过10微秒的标记一个“+”号,超过1000微秒的标记为一个“!”号。通过echo function_graph > current_tracer可以启用函数图跟踪器。示例输入如图3所示。 |
| 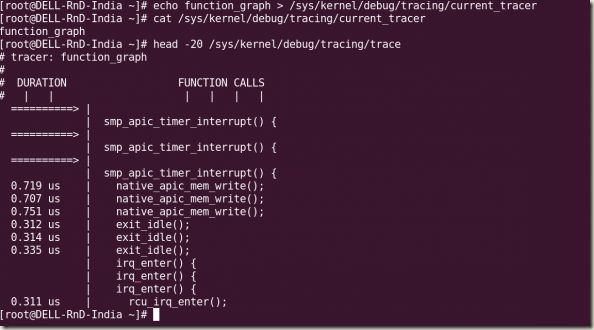
Figure 3: Trace output of function graph tracer 图3:函数图跟踪器跟踪输出 |
| There are a lot of tracers; the entire list is in linux/Documentation/trace/ftrace.txt. The tracers are enabled or disabled by echoing the tracer name into the current_tracer file. |
有很多跟踪器,所有的列表在linux/ Documentation/trace/ftrace.txt文件中找得到。通过将跟踪器的名字echo到current_tracer文件中可以启用或禁用相应跟踪器。 |
Dynamic tracing |
动态跟踪 |
| We can easily get inundated with the amount of data the function tracer throws at us. There is a dynamic way to filter just the functions we need, and eliminate those that we don’t need: to specify them in the file set_ftrace_filter. (First find the function(s) you want, from the available_filter_functions file.) See Figure 4 for an example of dynamic tracing. |
我们会很轻易地被淹没在函数跟踪器所抛给我们的大量数据中。有一种动态的方法可以过滤出我们所需要的函数,排除那些我们不需要的:在文件set_ftrace_filter中指明。(首先从available_filter_functions文件中找到你需要的函数。)图4就是一个动态跟踪的例子。 |
| 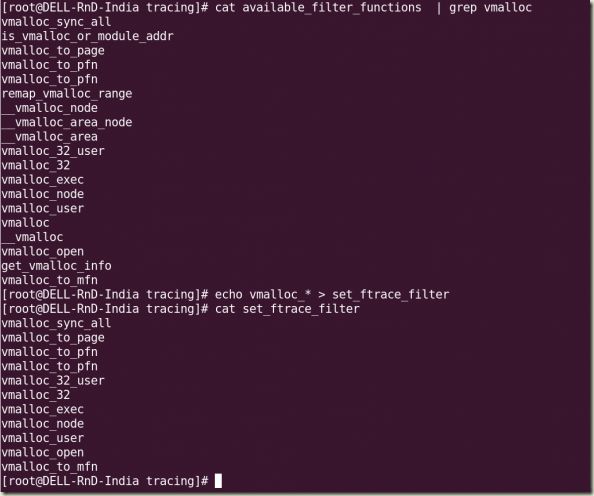
Figure 4: Listing filter functions, using with wild-cards 图4:使用通配符列出过滤出的函数 |
| As you can see, you can even use wild-cards for the functions’ names. I used all the vmalloc_ functions, and set them with: echo vmalloc_* > set_ftrace_filter. |
如你所看到的,你甚至可以对函数的名字使用通配符。我需要用所有的vmalloc_函数,通过echo vmalloc_* > set_ftrace_filter进行设置。 |
Event tracing |
事件跟踪 |
| Tracing can also be triggered when particular events happen on the system. Available system events are found in the file available_events: |
也可以在系统特定事件触发的时候打开跟踪。可以在available_events文件中找到所有可用的系统事件: |
| [root@DELL-RnD-India tracing]# cat available_events | head -10 kvmmmu:kvm_mmu_pagetable_walk kvmmmu:kvm_mmu_paging_element kvmmmu:kvm_mmu_set_accessed_bit kvmmmu:kvm_mmu_set_dirty_bit kvmmmu:kvm_mmu_walker_error kvmmmu:kvm_mmu_get_page kvmmmu:kvm_mmu_sync_page kvmmmu:kvm_mmu_unsync_page kvmmmu:kvm_mmu_prepare_zap_page kvm:kvm_entry |
| For example, to enable an event, you would use: echo sys_enter_nice >> set_event (note that you append the event name to the file, using the >> append redirector, and not >). To disable an event, precede the event name with a “!”: echo '!sys_enter_nice' >> set_event. See Figure 5 for a sample event tracing scenario. The available events are listed in the events directory as well. |
比如,为了启用某个事件,你需要:echo sys_enter_nice >> set_event(注意你是将事件的名字追加到文件中去,使用>>追加定向器,不是>)。要禁用某个事件,需要在名字前加上一个“!”号:echo '!sys_enter_nice' >> set_event。图5是一个事件跟踪场景示例。同样,可用的事件是列在事件目录里面的。 |
| 
Figure 5: Available tracing events, setting and ‘unsetting’ them. 图5:可用的跟踪事件,启用与禁用它们 |
| For further details about event tracing, read the file Documents/Trace/events.txt in the kernel directory. |
有关事件跟踪的更多细节,请阅读内核目录下Documents/Trace/events.txt文件。 |
trace-cmd and KernelShark |
trace-cmd and KernelShark |
| trace-cmd, introduced by Steven Rostedt in his July 2009 post to the LKML, makes it easy to manipulate the tracer. Follow these steps to get the latest version, including the GUI tool KernelShark, installed on your system: |
trace-cmd是由Steven Rostedt在2009年发在LKML上的,它可以让操作跟踪器更简单。以下几步是获取最新的版本并装在你的系统上,包括它的GUI工具KernelShark。 |
| wget http://ftp.be.debian.org/pub/linux/analysis/trace-cmd/trace-cmd-1.0.5.tar.gz[2] tar -zxvf trace-cmd-1.0.5.tar.gz cd trace-cmd* make make gui # compiles GUI tools (KernelShark)[3] make install make install_gui # installs GUI tools |
| With trace-cmd, tracing becomes a breeze (see Figure 6 for sample usage): |
有了trace-cmd,跟踪将变得小菜一碟(见图6的示例用法): |
| trace-cmd list ##to see available events trace-cmd record -e syscalls ls ##Initiate tracing on the syscall 'ls' ##(A file called trace.dat gets created in the current directory.) trace-cmd report ## displays the report from trace.dat |
| 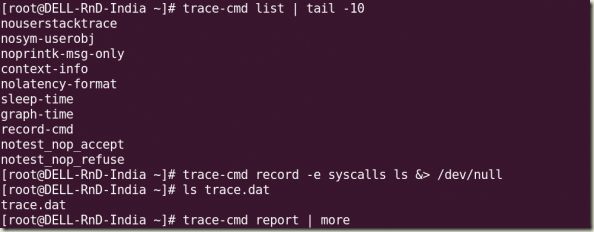
Figure 6: Using trace-cmd for recording and reporting 图6:用trace-cmd记录与汇报 |
| KernelShark, installed by the make install_gui step above, can be used to analyse the trace data in the file trace.dat, as shown in Figure 7. |
通过上面的make install_gui命令安装的KernelShark可以用于分析trace.dat文件中的跟踪数据,如图7所示。[4] |
| 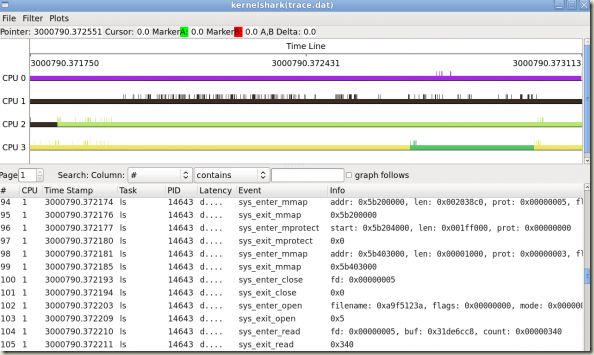 Figure 7: Analysing trace-cmd output with KernelShark 图7:使用KernelShark分析trace-cmd输出 Figure 7: Analysing trace-cmd output with KernelShark 图7:使用KernelShark分析trace-cmd输出
|