利用echarts-2.2.7做报表视图
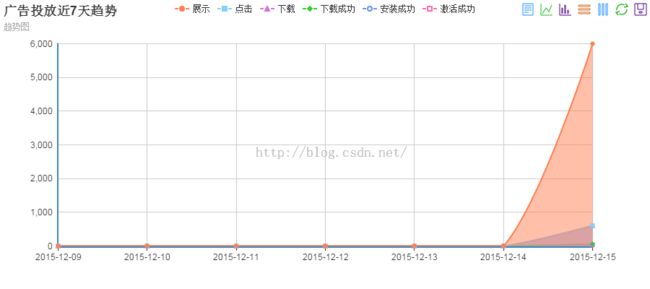
先上几张效果图


HTML:
<!DOCTYPE html>
<html >
  <head>
    <meta charset="UTF-8">
    <title>报表</title>
  </head>
  <body>
    <div id="main" style="width:900px;height:400px"></div>
<script src="${contextLocation}res/js/lib/echarts-2.2.7/build/dist/echarts-all.js" ></script>
<script>
	seajs.use("project/data/operation/adOperation.js",function (page) {
		page.init();
	});
</script>
  </body>
</html>
引入echarts-all.js这样就不用一个一个引入报表Js
adOperation.js:
define("project/data/operation/adOperation.js",function(require, exports, module) {
function init () {
	// 基于准备好的dom,初始化echarts图表
	var myChart = echarts.init(document.getElementById('main'));
	option = {
		    title : {
		        text: '广告投放近7天趋势',
		        subtext: '趋势图'
		    },
		    tooltip : {
		        trigger: 'axis'
		    },
		    legend: {
		        data:['展示','点击','下载','下载成功','安装成功','激活成功']
		    },
		    toolbox: {
		        show : true,
		        feature : {
		            dataView : {show: true, readOnly: false},
		            magicType : {show: true, type: ['line', 'bar', 'stack', 'tiled']},
		            restore : {show: true},
		            saveAsImage : {show: true}
		        }
		    },
		    calculable : true,
		    xAxis : [
		        {
		            boundaryGap : false,
		            data : []
		        }
		    ],
		    yAxis : [
		        {
		            type : 'value'
		        }
		    ],
		    series : [
		        {
		            name:'展示',
		            type:'line',
		            smooth:true,
		            itemStyle: {normal: {areaStyle: {type: 'default'}}},
		            data:[]
		        },
		        {
		            name:'点击',
		            type:'line',
		            smooth:true,
		            itemStyle: {normal: {areaStyle: {type: 'default'}}},
		            data:[]
		        },
		        {
		            name:'下载',
		            type:'line',
		            smooth:true,
		            itemStyle: {normal: {areaStyle: {type: 'default'}}},
		            data:[]
		        },
		        {
		            name:'下载成功',
		            type:'line',
		            smooth:true,
		            itemStyle: {normal: {areaStyle: {type: 'default'}}},
		            data:[]
		        },
		        {
		            name:'安装成功',
		            type:'line',
		            smooth:true,
		            itemStyle: {normal: {areaStyle: {type: 'default'}}},
		            data:[]
		        },
		        {
		            name:'激活成功',
		            type:'line',
		            smooth:true,
		            itemStyle: {normal: {areaStyle: {type: 'default'}}},
		            data:[]
		        }
		    ]
		};
	getChartData('');
	function getChartData(params) {
	    $.ajax({
	        url: contextLocation + "data/operation/reportAdQuery.html",
	        data: params,
	        type: "get",
	        dataType: "json",
	        success: function(data) {
	            if (data.return_code === '1') {
	            	option.xAxis[0].data = data.report.date;
	                option.series[0].data = data.report.showCount;
	                option.series[1].data = data.report.clickCount;
	                option.series[2].data = data.report.downloadCount;
	                option.series[3].data = data.report.dsCount;
	                option.series[4].data = data.report.installCount;
	                option.series[5].data = data.report.isCount;
	                //comAverageList = data.comAverageList;
	                myChart.setOption(option);
	            } else {
	            	option.xAxis[0].data = [];
	                option.series[0].data = [];
	                option.series[1].data = [];
	                option.series[2].data = [];
	                option.series[3].data = [];
	                option.series[4].data = [];
	                option.series[5].data = [];
	                myChart.setOption(option);
	            }
	        }
	    });
	}
}

return {
    init: init
};
});
这里引用了sea.js,
getChartData:这方法通过ajax事件从后台获取数据,然后再对报表中进行设置
	            	option.xAxis[0].data = data.report.date;
	                option.series[0].data = data.report.showCount;
	                option.series[1].data = data.report.clickCount;
	                option.series[2].data = data.report.downloadCount;
	                option.series[3].data = data.report.dsCount;
	                option.series[4].data = data.report.installCount;
	                option.series[5].data = data.report.isCount;
	                myChart.setOption(option);
{"return_msg":"操作成功","report":{"clickCount":["0","0","0","0","0","0","606"],"date":["2015-12-09","2015-12-10","2015-12-11","2015-12-12","2015-12-13","2015-12-14","2015-12-15"],"downloadCount":["0","0","0","0","0","0","600"],"dsCount":["0","0","0","0","0","0","60"],"installCount":["0","0","0","0","0","0","54"],"isCount":["0","0","0","0","0","0","30"],"length":1,"showCount":["0","0","0","0","0","0","6000"]},"return_code":"1"}