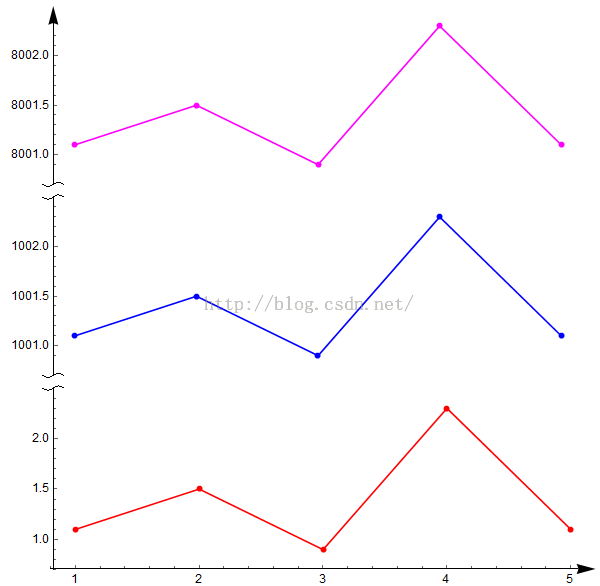
剪切坐标轴
一般的科学论文用图片可以用SciDraw在Mathematica上实现,有些特殊的功能,比如剪断坐标轴的,可以用下面方式:
ClearAll[snip]

snipCurve =
  Graphics[{BezierCurve[{{0, -(1/2)}, {1/3, 0}, {-1/3, 0}, {0,
       1/2}}]}];

snip[pos_?NumberQ, primitive_Graphics: snipCurve] :=
  snip[{pos}, primitive];

snip[pos_List, primitive_Graphics: snipCurve] :=
  Arrowheads[{Automatic, #, primitive} & /@ pos];

snip[pos_List, primitives_List] :=
  Arrowheads[
   Flatten /@ MapThread[{Automatic, ##} &, {pos, primitives}]];

snip[sizes_List, pos_List, primitives_List] :=
 Arrowheads[Flatten /@ Transpose[{sizes, pos, primitives}]]

data1 = {{1, 1.1}, {2, 1.5}, {3, 0.9}, {4, 2.3}, {5, 1.1}};
data2 = {{1, 1001.1}, {2, 1001.5}, {3, 1000.9}, {4, 1002.3}, {5,
    1001.1}};
data3 = {{1, 8001.1}, {2, 8001.5}, {3, 8000.9}, {4, 8002.3}, {5,
    8001.1}};

getMaxPadding[p_List] :=
 Map[Max, (BorderDimensions@
        Image[Show[#, LabelStyle -> White, Background -> White]] & /@
      p)~Flatten~{{3}, {2}}, {2}] + 1

p1 = ListPlot[data1, PlotRange -> All, Joined -> True, Mesh -> Full,
   PlotStyle -> Red,
   AxesStyle -> {{Arrowheads[.035(*here*), .035],
      Directive[Black, 12]}, {snip[1], Directive[Black, 12]}},
   PlotRangePadding -> .2, ImagePadding -> {{50, 5}, {15, 5}},
   AspectRatio -> 1/3];

p2 = ListPlot[data2, PlotRange -> All, Joined -> True, Mesh -> Full,
   PlotStyle -> Blue, Axes -> {False, True},
   AxesStyle -> {{None}, {snip[{0, 1}], Directive[Black, 12]}},
   PlotRangePadding -> .2, ImagePadding -> {{50, 15}, {3, 5}},
   AspectRatio -> 1/3];

p3 = ListPlot[data3, PlotRange -> All, Joined -> True, Mesh -> Full,
   PlotStyle -> Magenta, Axes -> {False, True},
   AxesStyle -> {{None}, {snip[{Automatic, .035}, {0,
        1}, {snipCurve, {}}], Directive[Black, 12]}},
   PlotRangePadding -> .2, ImagePadding -> {{50, 15}, {3, 5}},
   AspectRatio -> 1/3];

output = Column[{p3, p2, p1} /.
   Graphics[x__] :>
    Graphics[x, ImagePadding -> getMaxPadding[{p1, p2, p3}],
     ImageSize -> 600]]


Export["testOutputSnipAxis.png", output]
