Python中Matplotlib绘图
Matplotlib绘图是最著名的Python绘图库,主要用于二维绘图,画图质量高,方便快捷的绘图模块;
<1>绘图API--pyplot模块
<2>集成库---pylab模块(包含Numpy和pyplot中常用的函数)
我们可以打开matplotlib的官网点击打开链接点击任意一个图下面均有代码,例如:
效果图如下:
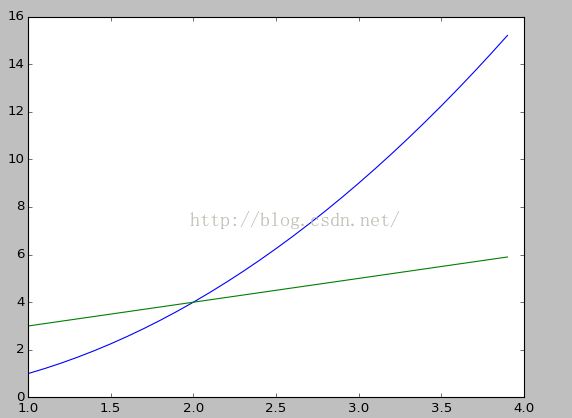
怎么样很漂亮吧!2、使用matplotlib画折线图使用pyplot:
import numpy as np
import matplotlib.pyplot as plt
x=np.arange(1,4,0.1)
plt.plot(x,x**2,x,x+2)

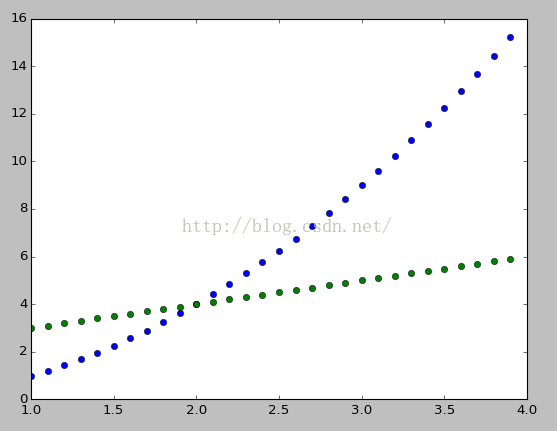
很简单,和matlab很像,plt.plot(x,y)即可;下面是画出上面图像的散点图,加‘o’即可:
<span style="font-size:18px;">import numpy as np
import matplotlib.pyplot as plt
x=np.arange(1,4,0.1)
plt.plot(x,x**2,'o',x,x+2,'o')</span>

下面我们再画出其中一个的柱状图,也特别简单将plt.plot变为plt.bar即可:
<span style="font-size:18px;">import numpy as np
import matplotlib.pyplot as plt
x=np.arange(1,4,0.1)
plt.bar(x,x**2)</span>

3、图的属性设置
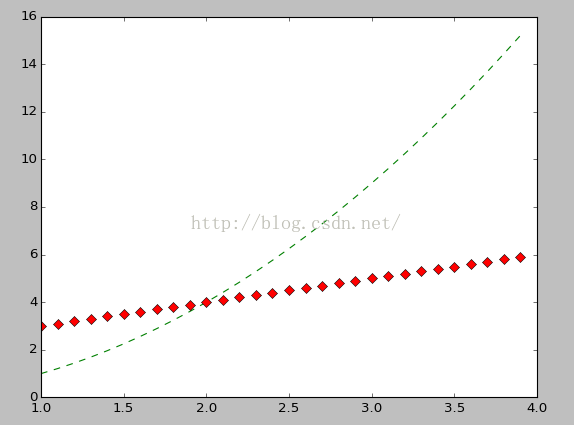
<1>绘图颜色和线条类型的改变
<span style="font-size:18px;">import numpy as np
import matplotlib.pyplot as plt
x=np.arange(1,4,0.1)
plt.plot(x,x**2,'g--',x,x+2,'rD')</span>

import numpy as np
import matplotlib.pyplot as plt
x=np.arange(1,4,0.1)
plt.plot(x,x**2,'rv',x,x+2,'gp')
可以在shell通过:
import matplotlib.pyplot as plt
help(plt.plot)查找相应的颜色和线型
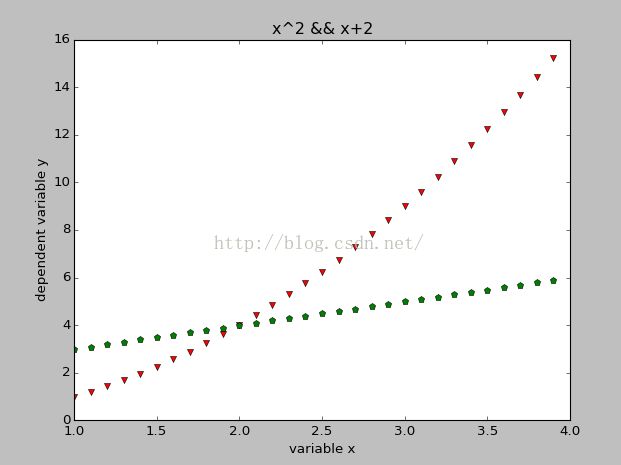
<2>增加文字,横轴、纵轴、图
<span style="font-size:18px;">import numpy as np
import matplotlib.pyplot as plt
x=np.arange(1,4,0.1)
plt.plot(x,x**2,'rv',x,x+2,'gp')
plt.title('x^2 && x+2')
plt.xlabel('variable x')
plt.ylabel('dependent variable y')</span>

<3>其他属性;图的大小,图例
<span style="font-size:18px;">import numpy as np
import matplotlib.pyplot as plt
x=np.arange(1,4,0.1)
plt.figure(figsize=(8,6),dpi=100)#大小、精度
plt.plot(x,x**2,color='red',linestyle='--',linewidth=3,label='line1')
plt.plot(x,x+2,color='blue',linestyle='',marker='*',linewidth=3,label='line2')
plt.legend(loc='upper left')
plt.show()</span>
<4>子窗口
import numpy as np
import matplotlib.pyplot as plt
x=np.arange(1,4,0.1)
plt.figure(figsize=(8,6),dpi=100)
plt.subplot(211)
plt.plot(x,x**2,color='red',linestyle='--',linewidth=3,label='line1')
plt.legend(loc='upper left')
plt.subplot(212)
plt.plot(x,x+2,color='blue',linestyle='',marker='*',linewidth=3,label='line2')
plt.legend(loc='upper left')
plt.show()
#这里subplot(211)代表2行1列第1个图

import numpy as np
import matplotlib.pyplot as plt
x=np.arange(1,4,0.1)
plt.figure(figsize=(8,6),dpi=100)
plt.subplot(121)
plt.plot(x,x**2,color='red',linestyle='--',linewidth=3,label='line1')
plt.legend(loc='upper left')
plt.subplot(122)
plt.plot(x,x+2,color='blue',linestyle='',marker='*',linewidth=3,label='line2')
plt.legend(loc='upper left')
plt.show()
import numpy as np
import matplotlib.pyplot as plt
x=np.arange(1,4,0.1)
plt.figure(figsize=(8,6),dpi=100)
plt.subplot(221)
plt.plot(x,x**2,color='red',linestyle='--',linewidth=3,label='line1')
plt.legend(loc='upper left')
plt.subplot(222)
plt.plot(x,x+2,color='blue',linestyle='',marker='*',linewidth=3,label='line2')
plt.legend(loc='upper left')
plt.subplot(223)
plt.plot(x,x**3,color='black',linestyle='',marker='+',linewidth=3,label='line3')
plt.legend(loc='upper left')
plt.subplot(224)
plt.plot(x,x+9,color='green',linestyle='',marker='p',linewidth=3,label='line4')
plt.legend(loc='upper left')
plt.show()

<5>另外一种绘制子图的方式-axes
import numpy as np
import matplotlib.pyplot as plt
plt.axes([0.1,0.1,0.8,0.8])
x=np.arange(1,4,0.1)
plt.plot(x,x**2,color='red',linestyle='--',linewidth=3,label='line1')
plt.legend(loc='upper left')
plt.axes([0.55,0.15,0.3,0.3])
plt.plot(x,x+2,color='blue',linestyle='',marker='*',linewidth=3,label='line2')
plt.legend(loc='upper left')
plt.show()
其中plt.axes(距左边的距离,距底部的距离,图的宽,图的高)
