ISLR第三章线性回归应用练习题答案(下)
ISLR;R语言; 机器学习 ;线性回归
一些专业词汇只知道英语的,中文可能不标准,请轻喷
12.没有截距的简单线性回归
a)观察3.38式可发现
set.seed(1)
x=rnorm(100)
y=2*x
lm.fit=lm(y~x+0)
lm.fit2=lm(x~y+0)
summary(lm.fit)
输出结果:
Call:
lm(formula = y ~ x + 0)

Residuals:
       Min         1Q     Median         3Q        Max
-3.776e-16 -3.378e-17  2.680e-18  6.113e-17  5.105e-16

Coefficients:
   Estimate Std. Error   t value Pr(>|t|)
x 2.000e+00  1.296e-17 1.543e+17   <2e-16 ***
---
Signif. codes:  0 ‘***’ 0.001 ‘**’ 0.01 ‘*’ 0.05 ‘.’ 0.1 ‘ ’ 1

Residual standard error: 1.167e-16 on 99 degrees of freedom
Multiple R-squared:      1,     Adjusted R-squared:      1
F-statistic: 2.382e+34 on 1 and 99 DF,  p-value: < 2.2e-16
线性回归2:
summary(lm.fit2)
输出结果:
Call:
lm(formula = x ~ y + 0)

Residuals:
       Min         1Q     Median         3Q        Max
-1.888e-16 -1.689e-17  1.339e-18  3.057e-17  2.552e-16

Coefficients:
  Estimate Std. Error   t value Pr(>|t|)
y 5.00e-01   3.24e-18 1.543e+17   <2e-16 ***
---
Signif. codes:  0 ‘***’ 0.001 ‘**’ 0.01 ‘*’ 0.05 ‘.’ 0.1 ‘ ’ 1

Residual standard error: 5.833e-17 on 99 degrees of freedom
Multiple R-squared:      1,     Adjusted R-squared:      1
F-statistic: 2.382e+34 on 1 and 99 DF,  p-value: < 2.2e-16
实验发现回归参数不同
c)
sample()函数能够从指定的特定对象集合中随机取样,通过指定某类对象的向量x,然后从中取样size。
例如,从整数1到10中取样,并从中不放回地抽取4个数字使用sample(1:10, 4)
,得到3、4、5、7。如果再做一遍得到的是3、9、8、5。因为选择不放回取样,所以不会得到重复的数字。
 > set.seed(1)
 > x=rnorm(100)
 > y=sample(x,100)
 > sum(x^2)
 [1] 81.05509
 > sum(y^2)
 [1] 81.05509
 > lm.fit=lm(y~x+0)
 > lm.fit2=lm(x~y+0)
 > summary(lm.fit)
输出结果:
 Call:
 lm(formula = y ~ x + 0)

 Residuals:
     Min      1Q  Median      3Q     Max
 -2.2315 -0.5124  0.1027  0.6877  2.3926

 Coefficients:
   Estimate Std. Error t value Pr(>|t|)
 x  0.02148    0.10048   0.214    0.831

 Residual standard error: 0.9046 on 99 degrees of freedom
 Multiple R-squared:  0.0004614, Adjusted R-squared:  -0.009635
 F-statistic: 0.0457 on 1 and 99 DF,  p-value: 0.8312
线性回归2:
 Call:
 lm(formula = x ~ y + 0)

 Residuals:
     Min      1Q  Median      3Q     Max
 -2.2400 -0.5154  0.1213  0.6788  2.3959

 Coefficients:
   Estimate Std. Error t value Pr(>|t|)
 y  0.02148    0.10048   0.214    0.831

 Residual standard error: 0.9046 on 99 degrees of freedom
 Multiple R-squared:  0.0004614, Adjusted R-squared:  -0.009635
 F-statistic: 0.0457 on 1 and 99 DF,  p-value: 0.8312
实验发现当x^2之和与y^2之和相等时,线性回归参数相等。
13.
a)
> set.seed(1)
> x=rnorm(100)
b)
> eps=rnorm(100,0,sqrt(0.25))
c)
> y=-1+0.5*x+eps
y向量长度为100;β0=-1;β1=0.5
d)
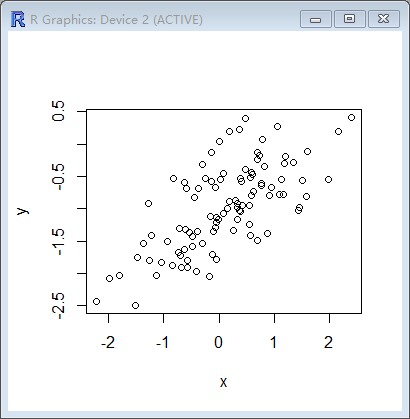
> plot(x,y)
> lm.fit=lm(y~x)
> summary(lm.fit)
输出结果
Call:
lm(formula = y ~ x)

Residuals:
     Min       1Q   Median       3Q      Max
-0.93842 -0.30688 -0.06975  0.26970  1.17309

Coefficients:
            Estimate Std. Error t value Pr(>|t|)
(Intercept) -1.01885    0.04849 -21.010  < 2e-16 ***
x            0.49947    0.05386   9.273 4.58e-15 ***
---
Signif. codes:  0 ‘***’ 0.001 ‘**’ 0.01 ‘*’ 0.05 ‘.’ 0.1 ‘ ’ 1

Residual standard error: 0.4814 on 98 degrees of freedom
Multiple R-squared:  0.4674,    Adjusted R-squared:  0.4619
F-statistic: 85.99 on 1 and 98 DF,  p-value: 4.583e-15
β ˆ0=-1.01885,β ˆ1=0.49947与β0=-1;β1=0.5相近,p值接近于零说明具有显著统计关系。
f)
> plot(x,y)
> abline(lm.fit,lwd=3,col="red")
> abline(-1,0.5,lwd=3,col="green")
> legend(-1,legend=c("model fit", "pop regression"),col=2:3,lwd=3)
> lm.fit2=lm(y~x+I(x^2))
> summary(lm.fit2)
输出结果:
Call:
lm(formula = y ~ x + I(x^2))

Residuals:
     Min       1Q   Median       3Q      Max
-0.98252 -0.31270 -0.06441  0.29014  1.13500

Coefficients:
            Estimate Std. Error t value Pr(>|t|)
(Intercept) -0.97164    0.05883 -16.517  < 2e-16 ***
x            0.50858    0.05399   9.420  2.4e-15 ***
I(x^2)      -0.05946    0.04238  -1.403    0.164
---
Signif. codes:  0 ‘***’ 0.001 ‘**’ 0.01 ‘*’ 0.05 ‘.’ 0.1 ‘ ’ 1

Residual standard error: 0.479 on 97 degrees of freedom
Multiple R-squared:  0.4779,    Adjusted R-squared:  0.4672
F-statistic:  44.4 on 2 and 97 DF,  p-value: 2.038e-14
R^2和RSE只有微弱的增加,x^2的t值为0.164说明y与x^2无显著统计关系
h)
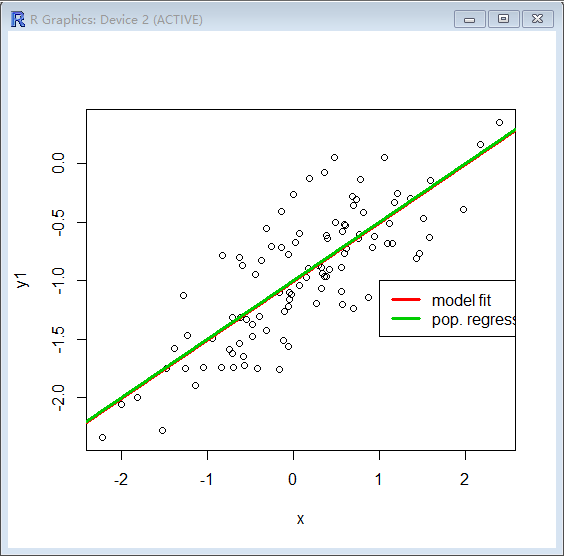
> set.seed(1)
> esp1=rnorm(100,0,sqrt(0.125))
> y1=-1+0.5*x + esp1
> plot(x,y1)
> lm.fit1=lm(y1~x)
> summary(lm.fit1)
输出结果:
Call:
lm(formula = y1 ~ x)

Residuals:
     Min       1Q   Median       3Q      Max
-0.66356 -0.21700 -0.04932  0.19071  0.82950

Coefficients:
            Estimate Std. Error t value Pr(>|t|)
(Intercept) -1.01333    0.03429  -29.55   <2e-16 ***
x            0.49963    0.03809   13.12   <2e-16 ***
---
Signif. codes:  0 ‘***’ 0.001 ‘**’ 0.01 ‘*’ 0.05 ‘.’ 0.1 ‘ ’ 1

Residual standard error: 0.3404 on 98 degrees of freedom
Multiple R-squared:  0.6371,    Adjusted R-squared:  0.6334
F-statistic: 172.1 on 1 and 98 DF,  p-value: < 2.2e-16
画图:
> abline(lm.fit1,lwd=3,col=2)
> abline(-1,0.5,lwd=3,col=3)
> legend(-1,legend=c("model fit","pop. regression"),col=2:3,lwd=3)
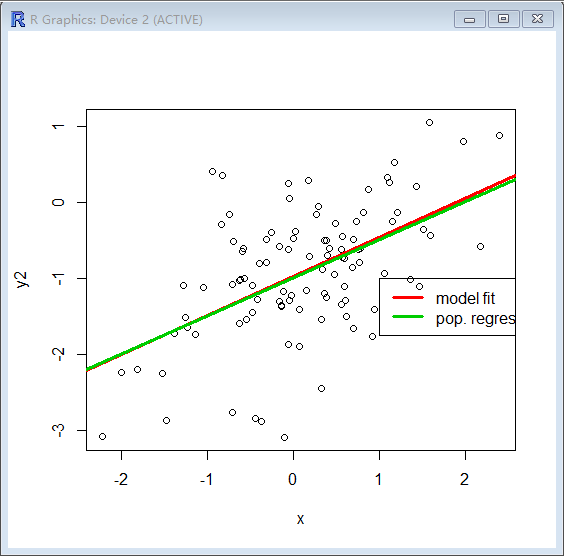
> esp2=rnorm(100,0,sqrt(0.5))
> y2=-1+0.5*x + esp2
> plot(x,y2)
> lm.fit2=lm(y2~x)
> summary(lm.fit2)
输出结果:
Call:
lm(formula = y2 ~ x)

Residuals:
     Min       1Q   Median       3Q      Max
-2.06059 -0.34104 -0.03205  0.45908  1.86787

Coefficients:
            Estimate Std. Error t value Pr(>|t|)
(Intercept) -0.98065    0.07404 -13.245  < 2e-16 ***
x            0.51497    0.08224   6.262 1.01e-08 ***
---
Signif. codes:  0 ‘***’ 0.001 ‘**’ 0.01 ‘*’ 0.05 ‘.’ 0.1 ‘ ’ 1

Residual standard error: 0.7349 on 98 degrees of freedom
Multiple R-squared:  0.2858,    Adjusted R-squared:  0.2785
F-statistic: 39.21 on 1 and 98 DF,  p-value: 1.01e-08
画图:
abline(lm.fit2,lwd=3,col=2)
abline(-1,0.5,lwd=3,col=3)
legend(-1,legend=c(“model fit”,”pop. regression”),col=2:3,lwd=3)
> confint(lm.fit)
                 2.5 %     97.5 %
(Intercept) -1.1150804 -0.9226122
x            0.3925794  0.6063602
> confint(lm.fit1)
                 2.5 %     97.5 %
(Intercept) -1.0813741 -0.9452786
x            0.4240422  0.5752080
> confint(lm.fit2)
                 2.5 %     97.5 %
(Intercept) -1.1275711 -0.8337236
x            0.3517741  0.6781604
噪声越大,置信区间相对越大。
14.
a)
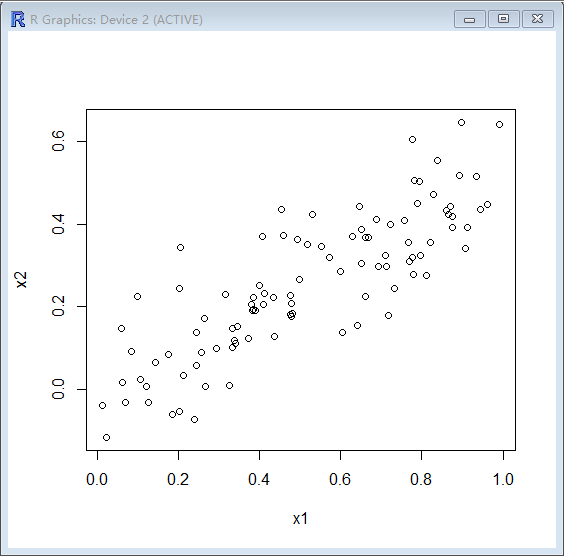
> cor(x1,x2)
[1] 0.8351212
> plot(x1,x2)
> lm.fit=lm(y~x1+x2)
> summary(lm.fit)

Call:
lm(formula = y ~ x1 + x2)

Residuals:
    Min      1Q  Median      3Q     Max
-2.8311 -0.7273 -0.0537  0.6338  2.3359

Coefficients:
            Estimate Std. Error t value Pr(>|t|)
(Intercept)   2.1305     0.2319   9.188 7.61e-15 ***
x1            1.4396     0.7212   1.996   0.0487 *
x2            1.0097     1.1337   0.891   0.3754
---
Signif. codes:  0 ‘***’ 0.001 ‘**’ 0.01 ‘*’ 0.05 ‘.’ 0.1 ‘ ’ 1

Residual standard error: 1.056 on 97 degrees of freedom
Multiple R-squared:  0.2088,    Adjusted R-squared:  0.1925
F-statistic:  12.8 on 2 and 97 DF,  p-value: 1.164e-05
β ˆ0=2.1305;β ˆ1=1.4396;β ˆ2=1.0097
β0=2;β1=2;β2=0.3;
由于t值过大,我们并不能拒绝β2 = 0的假设
d)
> lm.fit1=lm(y~x1)
> summary(lm.fit1)

Call:
lm(formula = y ~ x1)

Residuals:
     Min       1Q   Median       3Q      Max
-2.89495 -0.66874 -0.07785  0.59221  2.45560

Coefficients:
            Estimate Std. Error t value Pr(>|t|)
(Intercept)   2.1124     0.2307   9.155 8.27e-15 ***
x1            1.9759     0.3963   4.986 2.66e-06 ***
---
Signif. codes:  0 ‘***’ 0.001 ‘**’ 0.01 ‘*’ 0.05 ‘.’ 0.1 ‘ ’ 1

Residual standard error: 1.055 on 98 degrees of freedom
Multiple R-squared:  0.2024,    Adjusted R-squared:  0.1942
F-statistic: 24.86 on 1 and 98 DF,  p-value: 2.661e-06
由于p值接近于0可以拒绝H*0 : β*1 = 0假设
e)
> lm.fit2=lm(y~x2)
> summary(lm.fit2)

Call:
lm(formula = y ~ x2)

Residuals:
     Min       1Q   Median       3Q      Max
-2.62687 -0.75156 -0.03598  0.72383  2.44890

Coefficients:
            Estimate Std. Error t value Pr(>|t|)
(Intercept)   2.3899     0.1949   12.26  < 2e-16 ***
x2            2.8996     0.6330    4.58 1.37e-05 ***
---
Signif. codes:  0 ‘***’ 0.001 ‘**’ 0.01 ‘*’ 0.05 ‘.’ 0.1 ‘ ’ 1

Residual standard error: 1.072 on 98 degrees of freedom
Multiple R-squared:  0.1763,    Adjusted R-squared:  0.1679
F-statistic: 20.98 on 1 and 98 DF,  p-value: 1.366e-05
由于p值接近于0可以拒绝H*0 : β*1 = 0假设
f)
因为x1与x2共线的,所以当x1与x2一起做线性回归时很难区分他们的影响,当他们分别做线性回归就很清晰了。
g)
> x1=c(x1,0.1)
> x1=c(x1,0.1)
> x2=c(x2,0.8)
> y=c(y,6)
> lm.fit1 = lm(y~x1+x2)
> summary(lm.fit1)

Call:
lm(formula = y ~ x1 + x2)

Residuals:
     Min       1Q   Median       3Q      Max
-2.73348 -0.69318 -0.05263  0.66385  2.30619

Coefficients:
            Estimate Std. Error t value Pr(>|t|)
(Intercept)   2.2267     0.2314   9.624 7.91e-16 ***
x1            0.5394     0.5922   0.911  0.36458
x2            2.5146     0.8977   2.801  0.00614 **
---
Signif. codes:  0 ‘***’ 0.001 ‘**’ 0.01 ‘*’ 0.05 ‘.’ 0.1 ‘ ’ 1

Residual standard error: 1.075 on 98 degrees of freedom
Multiple R-squared:  0.2188,    Adjusted R-squared:  0.2029
F-statistic: 13.72 on 2 and 98 DF,  p-value: 5.564e-06

> lm.fit2 = lm(y~x1)
> summary(lm.fit2)

Call:
lm(formula = y ~ x1)

Residuals:
    Min      1Q  Median      3Q     Max
-2.8897 -0.6556 -0.0909  0.5682  3.5665

Coefficients:
            Estimate Std. Error t value Pr(>|t|)
(Intercept)   2.2569     0.2390   9.445 1.78e-15 ***
x1            1.7657     0.4124   4.282 4.29e-05 ***
---
Signif. codes:  0 ‘***’ 0.001 ‘**’ 0.01 ‘*’ 0.05 ‘.’ 0.1 ‘ ’ 1

Residual standard error: 1.111 on 99 degrees of freedom
Multiple R-squared:  0.1562,    Adjusted R-squared:  0.1477
F-statistic: 18.33 on 1 and 99 DF,  p-value: 4.295e-05

> lm.fit3 = lm(y~x2)
> summary(lm.fit3)

Call:
lm(formula = y ~ x2)

Residuals:
     Min       1Q   Median       3Q      Max
-2.64729 -0.71021 -0.06899  0.72699  2.38074

Coefficients:
            Estimate Std. Error t value Pr(>|t|)
(Intercept)   2.3451     0.1912  12.264  < 2e-16 ***
x2            3.1190     0.6040   5.164 1.25e-06 ***
---
Signif. codes:  0 ‘***’ 0.001 ‘**’ 0.01 ‘*’ 0.05 ‘.’ 0.1 ‘ ’ 1

Residual standard error: 1.074 on 99 degrees of freedom
Multiple R-squared:  0.2122,    Adjusted R-squared:  0.2042
F-statistic: 26.66 on 1 and 99 DF,  p-value: 1.253e-06
新的数据导致y1中不能拒绝β1=0假设。
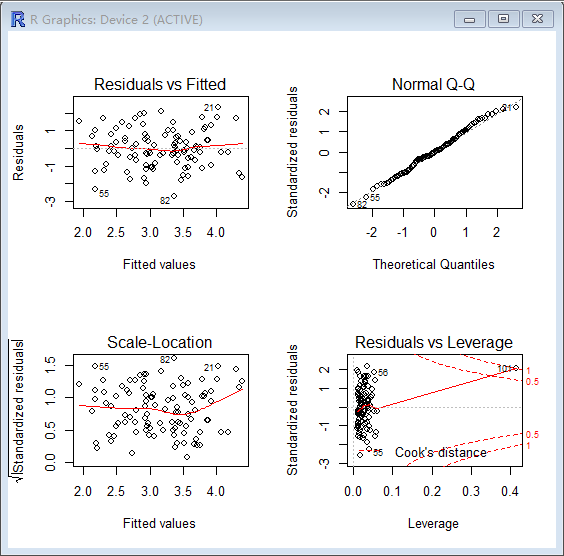
> par(mfrow=c(2,2))
> plot(lm.fit1)
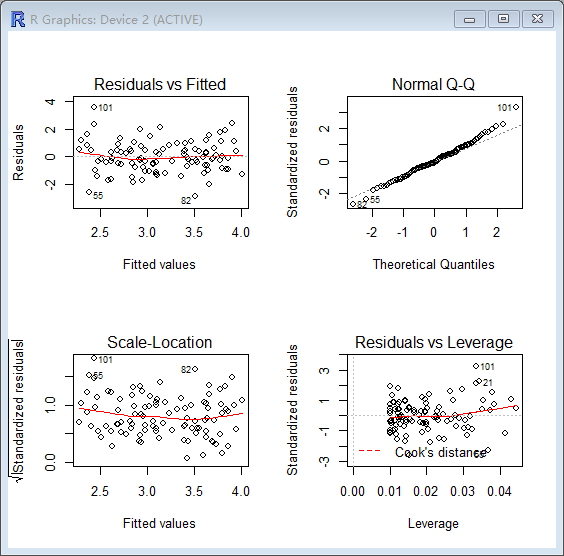
> par(mfrow=c(2,2))
> plot(lm.fit2)
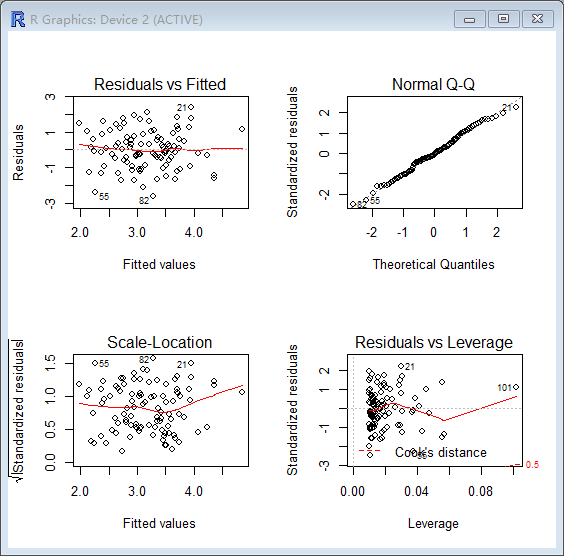
> par(mfrow=c(2,2))
> plot(lm.fit3)
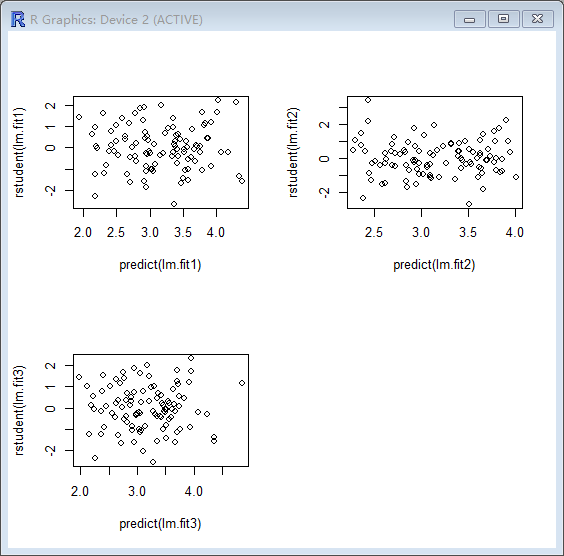
> plot(predict(lm.fit1), rstudent(lm.fit1))
> plot(predict(lm.fit2), rstudent(lm.fit2))
> plot(predict(lm.fit3), rstudent(lm.fit3))

