R语言学习 随笔 01
R语言是机器学习的一大利器,很多有秀代码都这他来写的,为了学习之,还是要学的。R的Rstudio也是很好用的IDE,原来用的MATLAB后来学了Python,现在学R感觉这布局更让人亲切。
本文是初学R语言时的随笔,适合新手查看,如有错误,敬请纠正,不胜感激。
package 安装
自动安装
R的package安装,十分简便,以安装forecast为例,只需要在Rstudio的console里输入install.packages(‘forecast’),就可以进行安装了,而且相关包也会一起安装啦,之后会显示,网址,包的大小,下载保存的地址。
手动安装
暂时没用到,加个别人的连接
http://www.cnblogs.com/emanlee/archive/2012/12/05/2803606.html
nrow()
用于计算array vector 或者dataframe的行数
类似的有ncol, NROW,NCOL
但是
NCOL and NROW 将vector 视为1-column矩阵
例子:
ma <- matrix(1:12, 3, 4)
nrow(ma)   # 3
ncol(ma)   # 4

ncol(array(1:24, dim = 2:4)) # 3, the second dimension
NCOL(1:12) # 1
NROW(1:12) # 12
aggregate()
类似于Python中的groupby
> aggregate(Survived ~ Child + Sex, data=train, FUN=length)
  Child    Sex Survived
1     0 female      259
2     1 female       55
3     0   male      519
4     1   male       58
> aggregate(Survived ~ Child + Sex, data=train, FUN=function(x) {sum(x)/length(x)})
Child Sex Survived
1 0 female 0.7528958
2 1 female 0.6909091
3 0 male 0.1657033
4 1 male 0.3965517aggregate(Survived ~ Fare2 + Pclass + Sex, data=train, FUN=function(x) {sum(x)/length(x)})
Fare2 Pclass Sex Survived
1 20-30 1 female 0.8333333
2 30+ 1 female 0.9772727
3 10-20 2 female 0.9142857
4 20-30 2 female 0.9000000
5 30+ 2 female 1.0000000
6 <10 3 female 0.5937500
7 10-20 3 female 0.5813953
8 20-30 3 female 0.3333333 **
9 30+ 3 female 0.1250000 **
10 <10 1 male 0.0000000
11 20-30 1 male 0.4000000
12 30+ 1 male 0.3837209
13 <10 2 male 0.0000000
14 10-20 2 male 0.1587302
15 20-30 2 male 0.1600000
16 30+ 2 male 0.2142857
17 <10 3 male 0.1115385
18 10-20 3 male 0.2368421
19 20-30 3 male 0.1250000
20 30+ 3 male 0.2400000第一个是求和,第二个是看数量,第三个是应用函数
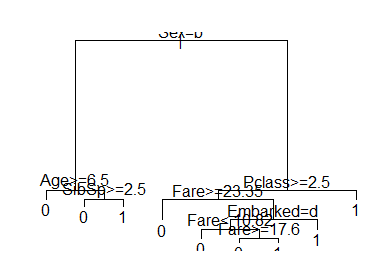
决策树 R rpart
Recursive Partitioning and Regression Trees
rpart(formula, data, weights, subset, na.action = na.rpart, method, model = FALSE, x = FALSE, y = TRUE, parms, control, cost, ...)> fit <- rpart(Survived ~ Pclass + Sex + Age + SibSp + Parch + Fare + Embarked, data=train, method="class") > plot(fit) > text(fit)rep 重复数组
这个要比Python简单些
> rep(c(1,2,3),3)
[1] 1 2 3 1 2 3 1 2 3
> rep(c(1,2,3),each=3)
[1] 1 1 1 2 2 2 3 3 3
产生数组
> seq(0,by=.3,to=1)
[1] 0.0 0.3 0.6 0.9

> seq(from=0,by=.3 ,length=3)
[1] 0.0 0.3 0.6