android下使用graphview做图形显示界面
此次是要做了一个图形显示界面,在网上找了一下,有好多开源的包可用。这里,我选择了graphview来做,个人偏好吧。下面就说说graphview的使用方法了。
首先下载graphview包,解压,在public目录下,找到graphview-3.1.jar文件,将其放入安卓工程下的libs文件夹,之后,我们就可以调用它写好的方法了。编程时可以参考doc目录下的allclasses-frame.html
@Override
	protected void onCreate(Bundle savedInstanceState) {
		// TODO Auto-generated method stub
		super.onCreate(savedInstanceState);
		setContentView(R.layout.graph);

		dayString = getNowTime("yyyy-MM-dd");
		ChooseBar = getIntent().getStringExtra("type").equals("bar");
		// draw random curve
		int num = 10;
		GraphViewData[] data = new GraphViewData[num];
		double v = 0;
		for (int i = 0; i < num; i++) {
			v += 0.2;
			data[i] = new GraphViewData(i, getRandom());
		}
		// graph with dynamically genereated horizontal and vertical labels
		if (ChooseBar) {
			graphView = new BarGraphView(this, "GraphDemo");
		} else {
			graphView = new LineGraphView(this, "GraphDemo");
			// ((LineGraphView) graphView).setDrawBackground(true);// 画图时加阴影
		}
		graphView.setCustomLabelFormatter(new CustomLabelFormatter() {

			@Override
			public String formatLabel(double value, boolean isValueX) {
				// TODO Auto-generated method stub
				if (isValueX) {
					if (value <= 0)
						return "0";
					else {
						return null;
					}
				} else {
					if ((Math.round(value) == 0)) {
						return "标签一";
					} else if ((Math.round(value) == 1)) {
						return "标签二";
					} else if ((Math.round(value) == 2)) {
						return "标签三";
					} else {
						return " ";
					}
//					 return null;
				}
			}
		});

		testSeries = new GraphViewSeries("label1", new GraphViewSeriesStyle(
				Color.rgb(90, 250, 00), 4), new GraphViewData[] {
//				new GraphViewData(1, 2.0d), new GraphViewData(2, 3.0d),
//				new GraphViewData(3, 4.0d), new GraphViewData(4, 0.0d)
				});// 线条颜色,线条粗细
		testSeries.getStyle().color = Color.CYAN;// 修改线条颜色
		series1 = new GraphViewSeries("label2", new GraphViewSeriesStyle(
				Color.rgb(90, 250, 00), 3), new GraphViewData[] {
//				new GraphViewData(1, 1.0d), new GraphViewData(2, 1.0d),
//				new GraphViewData(3, 1.0d), new GraphViewData(4, 1.0d)
				});
		series1.getStyle().color = Color.BLUE;// 修改线条颜色
		series1.getStyle().thickness = 1;
		series2 = new GraphViewSeries("label3", new GraphViewSeriesStyle(
				Color.rgb(90, 250, 00), 3), new GraphViewData[] {
//				new GraphViewData(1, 2.0d), new GraphViewData(2, 2.0d),
//				new GraphViewData(3, 2.0d), new GraphViewData(4, 2.0d)
				});
		series2.getStyle().color = Color.RED;// 修改线条颜色
		series2.getStyle().thickness = 1;

		// add data
		graphView.addSeries(testSeries);
		if (!ChooseBar) {
			graphView.addSeries(series1);
			graphView.addSeries(series2);
		}
		// set view port, start=2, size=10
		graphView.setViewPort(1, 24);
		if (ChooseBar) {
			graphView.setViewPort(1, 24);
		}
		graphView.setScalable(true);
		graphView.setShowLegend(true);
		graphView.setLegendAlign(LegendAlign.BOTTOM);
		graphView.setLegendWidth(150);
		// graphView.getGraphViewStyle().setGridColor(Color.TRANSPARENT);
		graphView.getGraphViewStyle().setTextSize(25);
//		if (!ChooseBar) {
			graphView.getGraphViewStyle().setNumHorizontalLabels(13);
			graphView.getGraphViewStyle().setNumVerticalLabels(3);
//		}
		// 设置时间
		graphView.setTitle(getNowTime("yyyy-MM-dd HH:mm:ss") + "state");
		// time.setToNow();
		// int year = time.year;
		// int month=time.month;
		// int day = time.monthDay;
		// graphView.setTitle(String.valueOf(year)+"年"+month+"月"+day+"日");

		// set manual Y axis bounds
		graphView.setManualYAxisBounds(2, 0);
		LinearLayout layout = (LinearLayout) findViewById(R.id.graph1);
		layout.addView(graphView);
	}
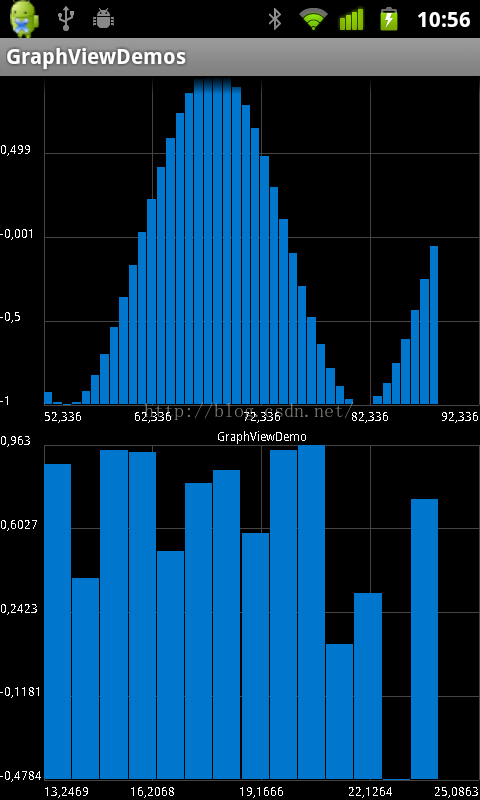
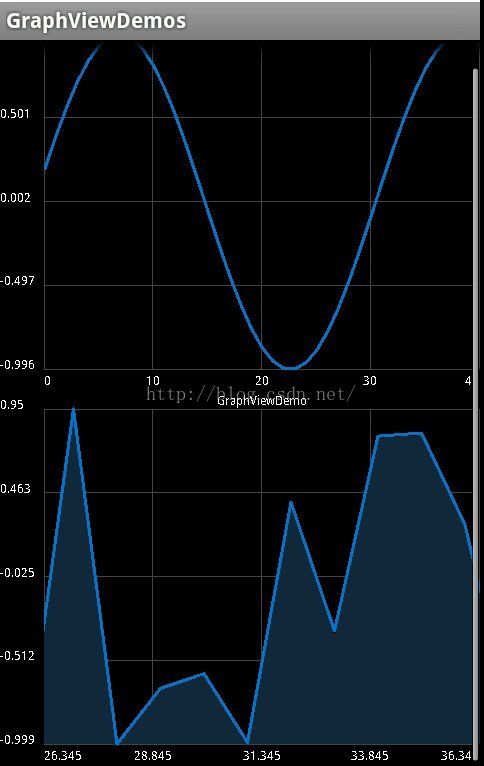
列出几幅图:

