JFreeChart 使用介绍
一、简介
JFreeChart是JAVA平台上的一个开放的图表绘制类库。它完全使用JAVA语言编写,是为applications, applets, servlets 以及JSP等使用所设计。
JFreeChart可生成饼图(pie charts)、柱状图(bar charts)、散点图(scatter plots)、时序图(time series)、甘特图(Gantt charts)等等多种图表,并且可以产生PNG和JPEG格式的输出,还可以与PDF和EXCEL关联。
二、下载安装
1 相关网址:
- 官方网址 http://www.jfree.org
- 官方文档 http://www.jfree.org/jfreechart/api/javadoc/index.html
- 官方下载 http://www.jfree.org/jfreechart/download.html
2 所需jar包:
- 解压jfreechart-1.0.14.zip,并打开lib文件夹;
- 将jfreechart-1.0.14.jar、jcommon-1.0.17.jar导入自己的工程当中;
三、配置使用:
下面介绍生成柱状图、饼图、折线图的简单生成方式及生成的图的展现方式,如:图片文件、jsp页面。
1 柱状图:
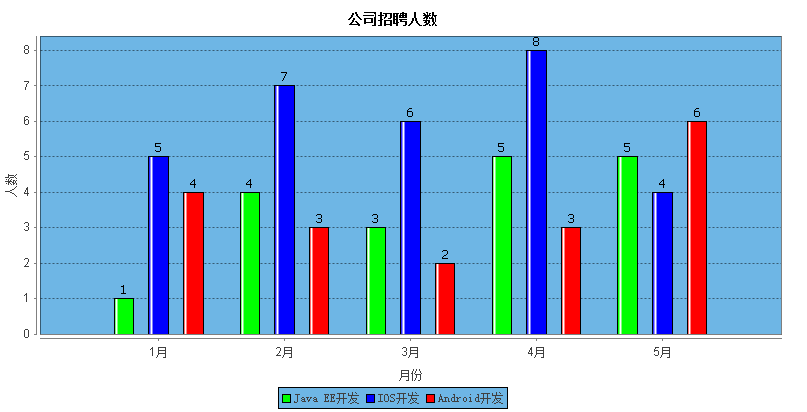
下边的方法为生成柱状图的方法:
|
1
2
3
4
5
6
7
8
9
10
11
12
13
14
15
16
17
18
19
20
21
22
23
24
25
26
27
28
29
30
31
32
33
34
35
36
37
38
39
40
41
42
43
44
45
46
47
48
49
50
51
52
53
54
55
56
57
58
59
60
61
62
63
64
65
66
67
68
69
70
71
72
73
74
75
76
77
78
79
80
81
82
83
84
85
86
87
88
89
90
91
92
93
94
95
96
97
98
99
100
101
102
103
104
105
106
107
108
109
|
/**
* 创建柱状图
* @param chartTitle 图表标题
* @param xName x轴标题
* @param yName y轴标题
* @param dataset 数据集
* @return
*/
public
static
JFreeChart createChart(String chartTitle, String xName,
String yName, CategoryDataset dataset) {
/**
* createBarChart的参数分别为:
* 标题,横坐标标题,纵坐标标题,数据集,图标方向(水平、垂直)
* ,是否显示图例,是否显示tooltips,是否urls
*/
JFreeChart chart = ChartFactory.createBarChart(
chartTitle, xName, yName,
dataset, PlotOrientation.VERTICAL,
true
,
true
,
false
);
/**
* VALUE_TEXT_ANTIALIAS_OFF表示将文字的抗锯齿关闭,
* 使用的关闭抗锯齿后,字体尽量选择12到14号的宋体字,这样文字最清晰好看
*/
chart.getRenderingHints().put(RenderingHints.KEY_TEXT_ANTIALIASING,
RenderingHints.VALUE_TEXT_ANTIALIAS_OFF);
// 背景色
chart.setBackgroundPaint(Color.white);
// 设置标题字体
chart.getTitle().setFont(
new
Font(
"宋体"
, Font.BOLD,
14
));
// 图例背景色
chart.getLegend().setBackgroundPaint(
new
Color(
110
,
182
,
229
));
// 图例字体
chart.getLegend().setItemFont(
new
Font(
"宋体"
, Font.PLAIN,
12
));
CategoryPlot categoryPlot = (CategoryPlot) chart.getPlot();
// 设置纵虚线可见
//categoryPlot.setDomainGridlinesVisible(true);
// 虚线色彩
//categoryPlot.setDomainGridlinePaint(Color.black);
// 设置横虚线可见
categoryPlot.setRangeGridlinesVisible(
true
);
// 虚线色彩
categoryPlot.setRangeGridlinePaint(Color.black);
// 设置柱的透明度
categoryPlot.setForegroundAlpha(
1
.0f);
//设置柱图背景色(注意,系统取色的时候要使用
//16位的模式来查看颜色编码,这样比较准确)
categoryPlot.setBackgroundPaint(
new
Color(
110
,
182
,
229
));
/*
* categoryPlot.setRangeCrosshairVisible(true);
* categoryPlot.setRangeCrosshairPaint(Color.blue);
*/
// 纵坐标--范围轴
NumberAxis numberAxis = (NumberAxis) categoryPlot.getRangeAxis();
// 纵坐标y轴坐标字体
numberAxis.setTickLabelFont(
new
Font(
"sans-serif"
, Font.PLAIN,
12
));
// 纵坐标y轴标题字体
numberAxis.setLabelFont(
new
Font(
"宋体"
, Font.PLAIN,
12
));
// 设置最高的一个 Item 与图片顶端的距离
// numberAxis.setUpperMargin(0.5);
// 设置最低的一个 Item 与图片底端的距离
// numberAxis.setLowerMargin(0.5);
// 设置刻度单位 为Integer
numberAxis.setStandardTickUnits(NumberAxis.createIntegerTickUnits());
// 横坐标--类别轴、域
CategoryAxis categoryAxis = categoryPlot.getDomainAxis();
// 横坐标x轴坐标字体
categoryAxis.setTickLabelFont(
new
Font(
"sans-serif"
, Font.PLAIN,
12
));
// 横坐标x轴标题字体
categoryAxis.setLabelFont(
new
Font(
"宋体"
, Font.PLAIN,
12
));
// 类别轴的位置,倾斜度
categoryAxis.setCategoryLabelPositions(
CategoryLabelPositions.createUpRotationLabelPositions(
0
.5235987755982988D));
//横轴上的 Lable
//categoryAxis.setMaximumCategoryLabelWidthRatio(0.6f);
//是否完整显示
//设置距离图片左端距离
categoryAxis.setLowerMargin(
0
.1D);
// 设置距离图片右端距离
categoryAxis.setUpperMargin(
0
.1D);
// 渲染 - 中间的部分
BarRenderer barRenderer = (BarRenderer) categoryPlot.getRenderer();
// 设置柱子宽度
barRenderer.setMaximumBarWidth(
0.05
);
// 设置柱子高度
barRenderer.setMinimumBarLength(
0.2
);
// 设置柱子边框颜色
barRenderer.setBaseOutlinePaint(Color.BLACK);
// 设置柱子边框可见
barRenderer.setDrawBarOutline(
true
);
// 设置柱的颜色
barRenderer.setSeriesPaint(
0
,
new
Color(
0
,
255
,
0
));
barRenderer.setSeriesPaint(
1
,
new
Color(
0
,
0
,
255
));
barRenderer.setSeriesPaint(
2
,
new
Color(
255
,
0
,
0
));
// 设置每个柱之间距离
barRenderer.setItemMargin(
0
.2D);
// 显示每个柱的数值,并修改该数值的字体属性
barRenderer.setIncludeBaseInRange(
true
);
barRenderer.setBaseItemLabelGenerator(
new
StandardCategoryItemLabelGenerator());
barRenderer.setBaseItemLabelsVisible(
true
);
return
chart;
}
|
柱状图的数据集:
|
1
2
3
4
5
6
7
8
9
10
11
12
13
14
15
16
17
18
19
20
21
22
23
24
25
26
27
28
29
30
31
32
33
34
35
36
|
/**
* 柱状图数据集
*
* @return
*/
public
static
CategoryDataset createDataset() {
String str1 =
"Java EE开发"
;
String str2 =
"IOS开发"
;
String str3 =
"Android开发"
;
String str4 =
"1月"
;
String str5 =
"2月"
;
String str6 =
"3月"
;
String str7 =
"4月"
;
String str8 =
"5月"
;
DefaultCategoryDataset dataset =
new
DefaultCategoryDataset();
dataset.addValue(
1
.0D, str1, str4);
dataset.addValue(
4
.0D, str1, str5);
dataset.addValue(
3
.0D, str1, str6);
dataset.addValue(
5
.0D, str1, str7);
dataset.addValue(
5
.0D, str1, str8);
dataset.addValue(
5
.0D, str2, str4);
dataset.addValue(
7
.0D, str2, str5);
dataset.addValue(
6
.0D, str2, str6);
dataset.addValue(
8
.0D, str2, str7);
dataset.addValue(
4
.0D, str2, str8);
dataset.addValue(
4
.0D, str3, str4);
dataset.addValue(
3
.0D, str3, str5);
dataset.addValue(
2
.0D, str3, str6);
dataset.addValue(
3
.0D, str3, str7);
dataset.addValue(
6
.0D, str3, str8);
return
dataset;
}
|
2 饼图:
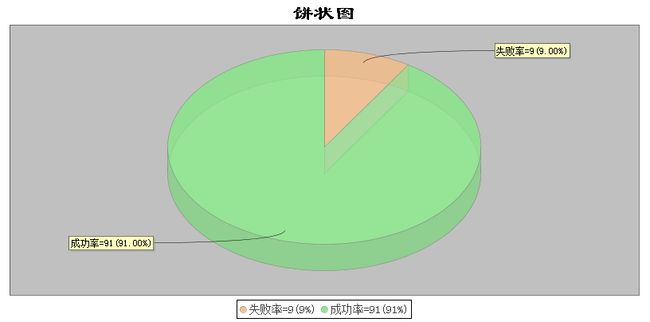
下边为饼图的生成方法和数据的生成方式:
|
1
2
3
4
5
6
7
8
9
10
11
12
13
14
15
16
17
18
19
20
21
22
23
24
25
26
27
28
29
30
31
32
33
34
35
36
37
38
39
40
41
42
43
44
45
46
47
48
49
50
51
52
53
54
55
56
57
58
59
60
61
62
63
64
65
66
67
68
69
70
71
72
73
74
75
76
77
78
79
80
81
82
83
84
85
86
87
88
89
90
|
/**
* 生成饼图
* @param chartTitle 图的标题
* @param dataset 数据集
* @param pieKeys 分饼的名字集
* @return
*/
public
static
JFreeChart createPieChart3D(
String chartTitle,
PieDataset dataset,
String[] pieKeys) {
JFreeChart chart = ChartFactory.createPieChart3D(
chartTitle,
dataset,
true
,
//显示图例
true
,
false
);
//关闭抗锯齿,是字体清晰
chart.getRenderingHints().put(
RenderingHints.KEY_TEXT_ANTIALIASING,
RenderingHints.VALUE_TEXT_ANTIALIAS_OFF);
chart.setTextAntiAlias(
false
);
//图片背景色
chart.setBackgroundPaint(Color.white);
//设置图标题的字体重新设置title
Font font =
new
Font(
"隶书"
, Font.BOLD,
25
);
chart.getTitle().setFont(font);
/*TextTitle title = new TextTitle(chartTitle);
title.setFont(font);
chart.setTitle(title);*/
//设置图例字体
chart.getLegend().setItemFont(
new
Font(
"宋体"
,Font.PLAIN,
14
));
PiePlot3D plot = (PiePlot3D) chart.getPlot();
// 图片中显示百分比:默认方式
// 指定饼图轮廓线的颜色
// plot.setBaseSectionOutlinePaint(Color.BLACK);
// plot.setBaseSectionPaint(Color.BLACK);
// 设置无数据时的信息
plot.setNoDataMessage(
"无对应的数据,请重新查询。"
);
// 设置无数据时的信息显示颜色
plot.setNoDataMessagePaint(Color.red);
// 图片中显示百分比:自定义方式,{0} 表示选项,
//{1} 表示数值, {2} 表示所占比例 ,小数点后两位
plot.setLabelGenerator(
new
StandardPieSectionLabelGenerator(
"{0}={1}({2})"
, NumberFormat.getNumberInstance(),
new
DecimalFormat(
"0.00%"
)));
//图片显示字体
plot.setLabelFont(
new
Font(
"宋体"
, Font.TRUETYPE_FONT,
12
));
// 图例显示百分比:自定义方式, {0} 表示选项,
//{1} 表示数值, {2} 表示所占比例
plot.setLegendLabelGenerator(
new
StandardPieSectionLabelGenerator(
"{0}={1}({2})"
));
// 指定图片的透明度(0.0-1.0)
plot.setForegroundAlpha(
0
.65f);
// 指定显示的饼图上圆形(false)还椭圆形(true)
plot.setCircular(
false
,
true
);
// 设置第一个 饼块section 的开始位置,默认是12点钟方向
plot.setStartAngle(
90
);
// // 设置分饼颜色
plot.setSectionPaint(pieKeys[
0
],
new
Color(
244
,
194
,
144
));
plot.setSectionPaint(pieKeys[
1
],
new
Color(
144
,
233
,
144
));
return
chart;
}
// 饼状图 数据集
public
static
PieDataset getDataPieSetByUtil(
double
[] data,
String[] datadescription) {
if
(data !=
null
&& datadescription !=
null
) {
if
(data.length == datadescription.length) {
DefaultPieDataset dataset =
new
DefaultPieDataset();
for
(
int
i =
0
; i < data.length; i++) {
dataset.setValue(datadescription[i], data[i]);
}
return
dataset;
}
}
return
null
;
}
|
3 折线图:
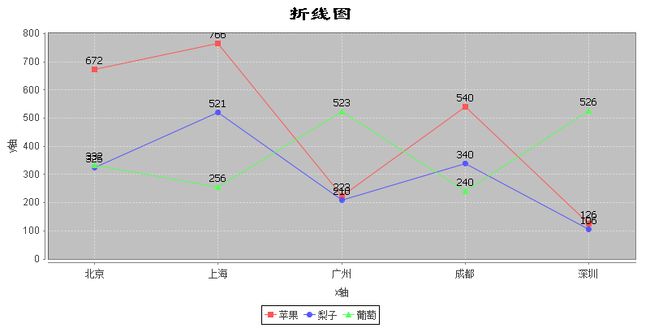
下边为折线图的生成方法,其中,数据集的生成方式和柱状图类似:
|
1
2
3
4
5
6
7
8
9
10
11
12
13
14
15
16
17
18
19
20
21
22
23
24
25
26
27
28
29
30
31
32
33
34
35
36
37
38
39
40
41
42
43
44
45
46
47
48
49
50
51
52
53
54
55
56
57
58
59
60
61
62
63
64
65
66
67
68
69
70
71
72
73
74
75
76
77
78
79
80
81
82
83
|
/**
* 生成折线图
* @param chartTitle 图的标题
* @param x 横轴标题
* @param y 纵轴标题
* @param dataset 数据集
* @return
*/
public
static
JFreeChart createLineChart(
String chartTitle, String x,
String y, CategoryDataset dataset) {
// 构建一个chart
JFreeChart chart = ChartFactory.createLineChart(
chartTitle,
x,
y,
dataset,
PlotOrientation.VERTICAL,
true
,
true
,
false
);
//字体清晰
chart.setTextAntiAlias(
false
);
// 设置背景颜色
chart.setBackgroundPaint(Color.WHITE);
// 设置图标题的字体
Font font =
new
Font(
"隶书"
, Font.BOLD,
25
);
chart.getTitle().setFont(font);
// 设置面板字体
Font labelFont =
new
Font(
"SansSerif"
, Font.TRUETYPE_FONT,
12
);
// 设置图示的字体
chart.getLegend().setItemFont(labelFont);
CategoryPlot categoryplot = (CategoryPlot) chart.getPlot();
// x轴 // 分类轴网格是否可见
categoryplot.setDomainGridlinesVisible(
true
);
// y轴 //数据轴网格是否可见
categoryplot.setRangeGridlinesVisible(
true
);
categoryplot.setRangeGridlinePaint(Color.WHITE);
// 虚线色彩
categoryplot.setDomainGridlinePaint(Color.WHITE);
// 虚线色彩
categoryplot.setBackgroundPaint(Color.lightGray);
// 折线图的背景颜色
// 设置轴和面板之间的距离
// categoryplot.setAxisOffset(new RectangleInsets(5D, 5D, 5D, 5D));
// 横轴 x
CategoryAxis domainAxis = categoryplot.getDomainAxis();
domainAxis.setLabelFont(labelFont);
// 轴标题
domainAxis.setTickLabelFont(labelFont);
// 轴数值
// domainAxis.setLabelPaint(Color.BLUE);//轴标题的颜色
// domainAxis.setTickLabelPaint(Color.BLUE);//轴数值的颜色
// 横轴 lable 的位置 横轴上的 Lable 45度倾斜 DOWN_45
domainAxis.setCategoryLabelPositions(CategoryLabelPositions.STANDARD);
// 设置距离图片左端距离
domainAxis.setLowerMargin(
0.0
);
// 设置距离图片右端距离
domainAxis.setUpperMargin(
0.0
);
// 纵轴 y
NumberAxis numberaxis = (NumberAxis) categoryplot.getRangeAxis();
numberaxis.setLabelFont(labelFont);
numberaxis.setTickLabelFont(labelFont);
numberaxis.setStandardTickUnits(NumberAxis.createIntegerTickUnits());
numberaxis.setAutoRangeIncludesZero(
true
);
// 获得renderer 注意这里是下嗍造型到lineandshaperenderer!!
LineAndShapeRenderer lineandshaperenderer = (LineAndShapeRenderer) categoryplot
.getRenderer();
lineandshaperenderer.setBaseShapesVisible(
true
);
// series 点(即数据点)可见
lineandshaperenderer.setBaseLinesVisible(
true
);
// series 点(即数据点)间有连线可见
// 显示折点数据
lineandshaperenderer
.setBaseItemLabelGenerator(
new
StandardCategoryItemLabelGenerator());
lineandshaperenderer.setBaseItemLabelsVisible(
true
);
return
chart;
}
|
4 图表的显示方式:
我总结了三种使用情况,分别为:
①生成图片到指定目录的方式;
②在servlet中使用,并在jsp页面中显示图片;
③在struts2中使用,并在jsp页面中显示图片;
第一种
第一种为生成指定的图片到指定的目录
需要用到ChartUtilities类的writeChartAsPNG方法,具体使用方式如下:
|
1
2
3
4
5
6
7
8
9
10
11
12
13
14
15
16
17
18
19
20
21
|
FileOutputStream fosChart =
null
;
try
{
//文件夹不存在则创建
File file =
new
File(CHART_PATH);
if
(!file.exists()) {
file.mkdirs();
}
String chartName = CHART_PATH + charName;
fosChart =
new
FileOutputStream(chartName);
//高宽的设置影响椭圆饼图的形状
ChartUtilities.writeChartAsPNG(fosChart, chart,
500
,
230
);
return
chartName;
}
catch
(Exception e) {
e.printStackTrace();
}
finally
{
try
{
fosChart.close();
}
catch
(Exception e) {
e.printStackTrace();
}
|