【Python】Matplotlib绘图库初探
Matplotlib是Python的2D&3D绘图库,产生各种已经拷贝格式和交互幻剑中跨平台形式的印刷质量图标。Matplot语法与Matlab相似,绘图绘图功能强大,而且十分容易上手。
“个人永远不能超过集体的力量”(Ken Blanchard)。Python强大的原因之一就在于其开源,有很多优秀的程序员为其提供了丰富的类库。Matplotlib就是其中之一,但他的创始人John D. Hunter英年早逝,在2012年8月份死于治疗癌症引起的并发症。向这位优秀的程序员致敬!
Numpy也是python的一个扩展包,提供基础的科学计算,包括:
- 强大的N维矩阵对象
- C/C++ 和 Fortran 代码集成工具
- 有用的线性代数、傅立叶转换和随机数生成函数
Numpy的下载地址:http://scipy.org/Download
Matlabplot的下载地址:https://github.com/matplotlib/matplotlib/downloads
安装都很简单,一路双击就可以~
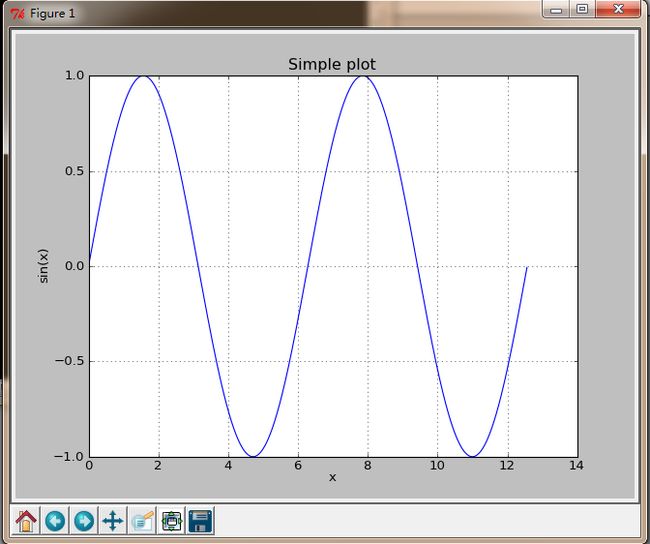
以下是一个简单的绘制正弦三角函数y=sin(x)的例子。
# plot a sine wave from 0 to 4pi
from pylab import *
x_values = arange(0.0, math.pi * 4, 0.01)
y_values = sin(x_values)
plot(x_values, y_values, linewidth=1.0)
xlabel('x')
ylabel('sin(x)')
title('Simple plot')
grid(True)
savefig("sin.png")
show()
效果如图:
pylab的plot函数与matlab很相似,也可以在后面增加属性值,可以用
help(pylab.plot)
查看说明
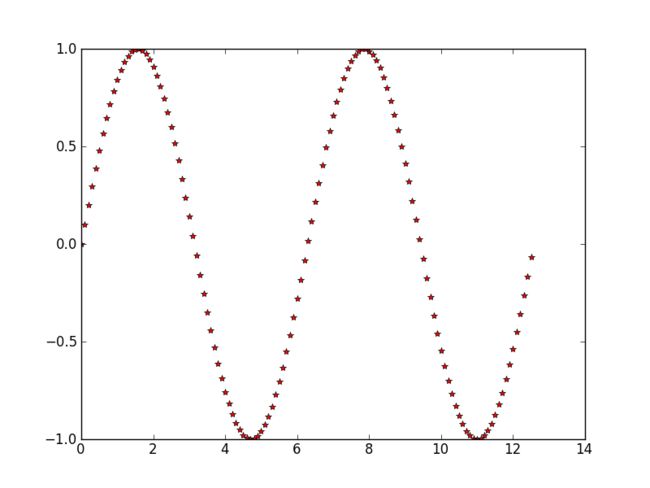
例如用‘r*’,即红色,星形来画图:
import os
import math
import pylab
y_values = []
x_values = []
num = 0.0
#collect both num and the sine of num in a list
while num < math.pi * 4:
    y_values.append(math.sin(num))
    x_values.append(num)
    num += 0.1

pylab.plot(x_values,y_values,'r*')
pylab.show()

Matplot中可以使用Latex来编辑公式。比如最上面那个Matplotlib的logo,背景的公式就是使用的Latex:
import numpy as np
import matplotlib as mpl
import matplotlib.pyplot as plt
import matplotlib.cm as cm

mpl.rcParams['xtick.labelsize'] = 10
mpl.rcParams['ytick.labelsize'] = 12
mpl.rcParams['axes.edgecolor'] = 'gray'


axalpha = 0.05
#figcolor = '#EFEFEF'
figcolor = 'white'
dpi = 80
fig = plt.figure(figsize=(6, 1.1),dpi=dpi)
fig.figurePatch.set_edgecolor(figcolor)
fig.figurePatch.set_facecolor(figcolor)


def add_math_background():
    ax = fig.add_axes([0., 0., 1., 1.])

    text = []
    text.append((r"$W^{3\beta}_{\delta_1 \rho_1 \sigma_2} = U^{3\beta}_{\delta_1 \rho_1} + \frac{1}{8 \pi 2} \int^{\alpha_2}_{\alpha_2} d \alpha^\prime_2 \left[\frac{ U^{2\beta}_{\delta_1 \rho_1} - \alpha^\prime_2U^{1\beta}_{\rho_1 \sigma_2} }{U^{0\beta}_{\rho_1 \sigma_2}}\right]$", (0.7, 0.2), 20))
    text.append((r"$\frac{d\rho}{d t} + \rho \vec{v}\cdot\nabla\vec{v} = -\nabla p + \mu\nabla^2 \vec{v} + \rho \vec{g}$",
                (0.35, 0.9), 20))
    text.append((r"$\int_{-\infty}^\infty e^{-x^2}dx=\sqrt{\pi}$",
                (0.15, 0.3), 25))
    #text.append((r"$E = mc^2 = \sqrt{{m_0}^2c^4 + p^2c^2}$",
    #            (0.7, 0.42), 30))
    text.append((r"$F_G = G\frac{m_1m_2}{r^2}$",
                (0.85, 0.7), 30))
    for eq, (x, y), size in text:
        ax.text(x, y, eq, ha='center', va='center', color="#11557c", alpha=0.25,
                transform=ax.transAxes, fontsize=size)
    ax.set_axis_off()
    return ax

def add_matplotlib_text(ax):
    ax.text(0.95, 0.5, 'matplotlib', color='#11557c', fontsize=65,
               ha='right', va='center', alpha=1.0, transform=ax.transAxes)

def add_polar_bar():
    ax = fig.add_axes([0.025, 0.075, 0.2, 0.85], polar=True)


    ax.axesPatch.set_alpha(axalpha)
    ax.set_axisbelow(True)
    N = 7
    arc = 2. * np.pi
    theta = np.arange(0.0, arc, arc/N)
    radii = 10 * np.array([0.2, 0.6, 0.8, 0.7, 0.4, 0.5, 0.8])
    width = np.pi / 4 * np.array([0.4, 0.4, 0.6, 0.8, 0.2, 0.5, 0.3])
    bars = ax.bar(theta, radii, width=width, bottom=0.0)
    for r, bar in zip(radii, bars):
        bar.set_facecolor(cm.jet(r/10.))
        bar.set_alpha(0.6)

    for label in ax.get_xticklabels() + ax.get_yticklabels():
        label.set_visible(False)

    for line in ax.get_ygridlines() + ax.get_xgridlines():
        line.set_lw(0.8)
        line.set_alpha(0.9)
        line.set_ls('-')
        line.set_color('0.5')

    ax.set_yticks(np.arange(1, 9, 2))
    ax.set_rmax(9)

if __name__ == '__main__':
    main_axes = add_math_background()
    add_polar_bar()
    add_matplotlib_text(main_axes)
    plt.show()


