Under the Hood
| In recent columns for MSJ (June 1999), I've discussed COM type libraries and database access layers such as ActiveX® Data Objects (ADO) and OLE DB. Longtime readers of my MSJ writings (both of them) probably think I've gone soft. To redeem myself, this month I'll tour part of the Windows NT® loader code where the operating system and your code come together. I'll also demonstrate a nifty trick for getting loader status information from the loader, and a related trick you can use in the Developer Studio® debugger. Consider what you know about EXEs, DLLs, and how they're loaded and initialized. You probably know that when a C++ DLL is loaded, its DllMain function is called. Think about what happens when your EXE implicitly links to some set of DLLs (for example, KERNEL32.DLL and USER32.DLL). In what order will those DLLs be initialized? Is it possible for one of your DLLs to be initialized before another DLL that you depend on? The Platform SDK has this to say under the "Dynamic-Link Library Entry-Point Function" section.
Given the stern warning about using LoadLibrary in the documentation, it's especially interesting that the Windows NT USER32.DLL explicitly ignores the preceding advice. You may be aware of a Windows NT only registry key called AppInit_Dlls that loads a list of DLLs into each process. It turns out that the actual loading of these DLLs occurs as part of USER32's initialization. USER32 looks at this registry key and calls LoadLibrary for these DLLs in its DllMain code. A little thought here reveals that the AppInit_Dlls trick doesn't work if your app doesn't use USER32.DLL. But I digress. My point in bringing this up is that DLL loading and initialization is still a gray area. In most cases, a simplified view of how the OS loader works is sufficient. In those oddball 5 percent of cases, however, you can go nuts unless you have a more detailed working model of how the OS loader behaves. Load 'er Up! What most programmers think of as module loading is actually two distinct steps. Step one is to map the EXE or DLL into memory. As this occurs, the loader looks at the Import Address Table (IAT) of the module and determines whether the module depends on additional DLLs. If the DLLs aren't already loaded in that process, the loader maps them in as well. This procedure recurses until all of the dependent modules have been mapped into memory. A great way to see all the implicitly dependent DLLs for a given executable is the DEPENDS program from the Platform SDK. |
 |
| Figure 2 An Invalid DLL Entry Point |
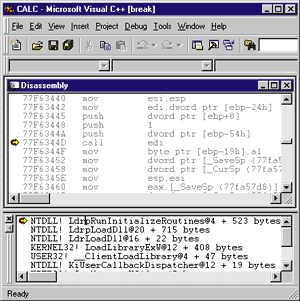
| Following the stack check, LdrpRunInitializeRoutines checks the return code from the entry point routine. For C++ DLLs, this is the value returned from DllMain. If the DLL returned 0, it usually means something is wrong and that the DLL doesn't want to remain loaded. When this happens, you get the dreaded "DLL Initialization Failed" dialog. The final portion of the third section of LdrpRunInitializeRoutines occurs after all the DLLs have been initialized. If the process EXE itself has TLS data, and if the implicitly linked DLLs are being initialized, the code calls _LdrpCallTlsInitializers. The fourth (and final) section of LdrpRunInitializeRoutines is the cleanup code. Remember earlier, when _RtlAllocateHeap created the pInitNodeArray? This memory needs to be freed, which occurs inside a __finally block. Even if one of the DLLs faults in its initialization code, the __try/__finally code ensures that _RtlFreeHeap is called to free pInitNodeArray. This ends our tour of LdrpRunInitializeRoutines, so let's now look at some side topics that the code presents. Debugging Initialization Routines Every once in a while I come across a problem where a DLL is faulting in its initialization code. Unfortunately, the fault could be from any one of several DLLs, and the operating system doesn't tell me which DLL is the culprit. In these circumstances you can get sneaky and use a debugger breakpoint to narrow down the problem. |
 |
| Figure 3 Setting a Breakpoint on CALL EDI |
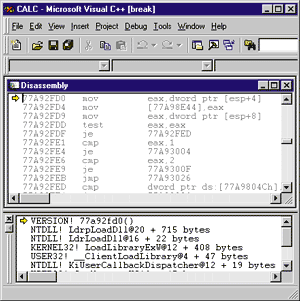
| If you choose to step into the CALL, you'll end up at the first instruction of the entry point of the DLL. It's important to understand that this code is almost never code you write. Rather, it's usually code in the runtime library that does its setup work and then calls your initialization code. For example, in a DLL written in Visual C++, the entry point is _DllMainCRTStartup, which is in CRTDLL.C. Without symbol tables or source code, what you'll see in the MSDEV assembly window will look something like Figure 4. |
 |
| Figure 4 Stepping into the CALL |
| Usually my debugging process follows a predictable pattern. Step one is to figure out which DLL is faulting. Do this by setting the aforementioned breakpoint, and make one instruction step into each DLL as it initializes. Using the debugger, figure out which DLL you're in, and write it down. One way to do this is to use the memory window to look on the stack (ESP) and obtain the HMODULE of the DLL you've entered. After you know which DLL you've entered, let the process continue (Go). In short order, the breakpoint should be hit again for the next DLL. Repeat this as often as necessary until you identify the problem DLL. You'll recognize the problem DLL because it will be called to initialize, but the process terminates before the initialization code returns. Step two is to drill into the faulting DLL. If the offending DLL is one that you have source for, try setting a breakpoint on your DllMain code, then let the process run to see if your breakpoint is hit. If you don't have source, just run the process. Your breakpoint on the CALL EDI instruction should still be in place from before. Keep running until you get to the one where the initialization faults. Step into this entry point, and keep stepping until you can ascertain the problem. This may require stepping through a lot of assembly code! I never said this was easy, but sometimes it's the only way to hunt the problem down. Finding the CALL EDI instruction can be tricky (at least with the current Microsoft® debuggers). You can see why I deliberately left this part of the pseudocode in assembler. For starters, you'll definitely need to have the correct NTDLL.DBG in your SYSTEM32 directory, alongside NTDLL.DLL. The debugger should automatically load the symbol table when you begin stepping through your program. Using the assembly window in Visual C++, you can (in theory) goto an address using a symbolic name. Here, you'd want to go to _LdrpRunInitializeRoutines@4 and then scroll down until you see the CALL EDI instruction. Unfortunately, the Visual C++ debugger doesn't recognize NTDLL symbol names unless you're already stopped in NTDLL.DLL. If you happen to know the address of _LdrpRunInitializeRoutines@4 (for instance, 0x77F63242 in Windows NT 4.0 SP 3 for Intel), you can type that in and the assembly window will happily display it. Heck, the IDE will even show you that it's the start of a function called _LdrpRunInitializeRoutines@4. If you're not a debugger guru, the failure to recognize the symbol name is extremely confusing. If you are a debugger nut like me, it's extremely annoying because you know what's causing the problem. WinDBG from the Platform SDK is a little better about recognizing symbol names. Once you've started the target process, you can set a breakpoint on _LdrpRunInitializeRoutines@4 using its name. Unfortunately, the first time you execute the process, execution blows past _LdrpRunInitializeRoutines@4 before you get a chance to set your breakpoint. To remedy this, start WinDBG, make one instruction step, set the breakpoint, stop debugging, and remain in the debugger. You can then restart the debuggee and the breakpoint will be hit on every invocation of _LdrpRunInitializeRoutines@4. This same trick works in the Visual C++ debugger. What's This ShowSnaps Thing? One of the first things that jumped out at me when I looked at the LdrpRunInitializeRoutines code was the _ShowSnaps global variable. Now's a good time to briefly divert to the subject of the GlobalFlag and GFlags.EXE. |
HKEY_LOCAL_MACHINE\SYSTEM\CurrentControlSet\Control\Session Manager |
| is a set of bitfields. Knowledge Base article Q147314 describes most of the bitfields, so I won't go into them here. In addition to this systemwide GlobalFlag value, individual executables can have their own distinct GlobalFlag value. The process-specific GlobalFlag value is found under |
HKEY_LOCAL_MACHINE\SOFTWARE\Microsoft\Windows NT
\CurrentVersion\Image File Execution Options\imagename |
| where imagename is the name of an executable (for instance, WinWord.exe). All of these documentation-challenged bitfields and highly nested resource keys scream out for a program to simplify it all. Wouldn't you know it, Microsoft has just such a program. |
 |
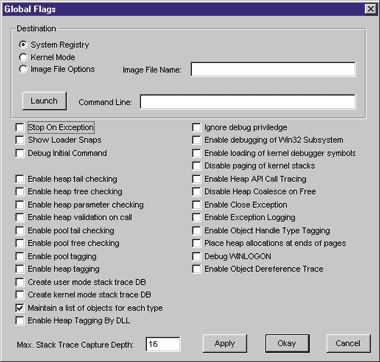
| Figure 5 GFlags.EXE |
| Figure 5 shows GFlags.EXE, which comes in the Windows NT 4.0 Resource Kit. Near the top-left of the GFlags window are three radio buttons. Selecting either of the top two (System Registry or Kernel Mode) lets you make changes to the global Session Manager value of GlobalFlags. If you select the third radio button (Image File Options), the set of available option checkboxes shrinks dramatically. This is because some of the GlobalFlag options only affect kernel mode code and don't make sense on a per-process basis. It's important to note that most of the kernel mode-only options assume you're using a system-level debugger such as i386kd. Without such a debugger to poke around or receive the output, there's not much use in enabling these options. To tie this back to the subject of _ShowSnaps, enabling the Show Loader Snaps option in GFlags causes the _ShowSnaps variable to be set to a nonzero value in NTDLL.DLL. In the registry, this bit value is 0x00000002, which is #defined as FLG_SHOW_LDR_SNAPS. Luckily, this bitflag is one of the GlobalFlag values that can be enabled on a per-process basis. The output can be quite voluminous if you enable it systemwide. Examining ShowSnaps Output Let's take a look at what sort of output enabling Show Loader Snaps produces. It turns out that other parts of the Windows NT loader that I haven't discussed also check this variable and emit additional output. Figure 6shows some abbreviated output from running CALC.EXE. To get the text, I first used GFlags to turn on Show Loader Snaps for CALC.EXE. Next, I ran CALC.EXE under the control of MSDEV.EXE and captured the output from the debug pane. |
LDR: ntdll.dll used by SHELL32.dll
LDR: Snapping imports for SHELL32.dll from ntdll.dll |
| The first line decrees that SHELL32.DLL links to APIs in NTDLL. The second line shows that the imported NTDLL APIs are being "snapped." When an executable module imports functions from another DLL, an array of function pointers resides in the importing module. This array of function pointers is known as the IAT. One of the loader's jobs is to locate the addresses of the imported functions and punch them into the IAT. Hence, the term "snapping" in the LDR: output. Another interesting set of lines in the output shows bound DLLs being handled: |
LDR: COMCTL32.dll bound to KERNEL32.dll
LDR: COMCTL32.dll has correct binding to KERNEL32.dll |
| In previous columns, I've talked about the binding process done by BIND.EXE or the BindImageEx API in IMAGEHLP.DLL. Binding an executable to a DLL is the act of looking up the address of the imported APIs and writing them to the importing executable. This speeds up the loading process since the imported addresses don't have to be looked up at load time. The first line in the above output indicates that the COMCTL32 has bound against APIs in KERNEL32.DLL. The second line indicates that the bound addresses are correct. The loader does this by comparing timestamps. If the timestamps don't match, the binding is invalid. In this case, the loader has to look up the imported addresses just as if the executable hadn't been bound in the first place. TLS Initialization I'll finish up this column by showing pseudocode for one other routine. In LdrpRunInitializeRoutines, right before the module's entry point is called, NTDLL checks to see if the module needs TLS initialization. If so, it calls LdrpCallTlsInitializers. Figure 7 shows my pseudocode for this routine. Conclusion This wraps up my coverage of Windows NT module initialization. Obviously, I have skipped or skimmed over a lot of related material. For example, what is the algorithm for determining the order in which the modules will be initialized? The algorithm Windows NT uses has changed at least once, and it would be nice to have a Microsoft technical note that at least gives some guidelines. Likewise, I haven't covered the mirror image topic: module unloading. However, I hope this glimpse into the inner workings of the Windows NT loader has provided you with material for further exploration. |