Zero Crossing Detector
http://homepages.inf.ed.ac.uk/rbf/HIPR2/zeros.htm
Zero Crossing Detector

Common Names: Zero crossing detector,
![]() Marr edge detector, Laplacian of Gaussian edge detector
Marr edge detector, Laplacian of Gaussian edge detector
Brief Description
The zero crossing detector looks for places in the Laplacian of an image where the value of the Laplacian passes through zero --- i.e. points where the Laplacian changes sign. Such points often occur at ![]() `edges' in images --- i.e. points where the intensity of the image changes rapidly, but they also occur at places that are not as easy to associate with edges. It is best to think of the zero crossing detector as some sort of feature detector rather than as a specific edge detector. Zero crossings always lie on closed contours, and so the output from the zero crossing detector is usually a binary image with single pixel thickness lines showing the positions of the zero crossing points.
`edges' in images --- i.e. points where the intensity of the image changes rapidly, but they also occur at places that are not as easy to associate with edges. It is best to think of the zero crossing detector as some sort of feature detector rather than as a specific edge detector. Zero crossings always lie on closed contours, and so the output from the zero crossing detector is usually a binary image with single pixel thickness lines showing the positions of the zero crossing points.
The starting point for the zero crossing detector is an image which has been filtered using the Laplacian of Gaussian filter. The zero crossings that result are strongly influenced by the size of the Gaussian used for the smoothing stage of this operator. As the smoothing is increased then fewer and fewer zero crossing contours will be found, and those that do remain will correspond to features of larger and larger scale in the image.
![]()
How It Works
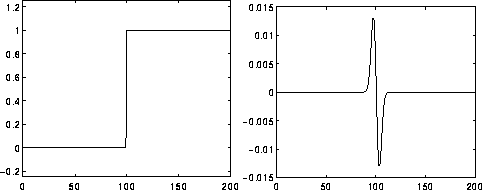
The core of the zero crossing detector is the Laplacian of Gaussian filter and so a knowledge of that operator is assumed here. As described there, `edges' in images give rise to zero crossings in the LoG output. For instance, Figure 1 shows the response of a 1-D LoG filter to a step edge in the image.

Figure 1 Response of 1-D LoG filter to a step edge. The left hand graph shows a 1-D image, 200 pixels long, containing a step edge. The right hand graph shows the response of a 1-D LoG filter with Gaussian standard deviation 3 pixels.
However, zero crossings also occur at any place where the image intensity gradient starts increasing or starts decreasing, and this may happen at places that are not obviously edges. Often zero crossings are found in regions of very low gradient where the intensity gradient wobbles up and down around zero.
Once the image has been LoG filtered, it only remains to detect the zero crossings. This can be done in several ways.
The simplest is to simply threshold the LoG output at zero, to produce a binary image where the boundaries between foreground and background regions represent the locations of zero crossing points. These boundaries can then be easily detected and marked in single pass, e.g. using some morphological operator. For instance, to locate all boundary points, we simply have to mark each foreground point that has at least one background neighbor.
The problem with this technique is that will tend to bias the location of the zero crossing edge to either the light side of the edge, or the dark side of the edge, depending on whether it is decided to look for the edges of foreground regions or for the edges of background regions.
A better technique is to consider points on both sides of the threshold boundary, and choose the one with the lowest absolute magnitude of the Laplacian, which will hopefully be closest to the zero crossing.
Since the zero crossings generally fall in between two pixels in the LoG filtered image, an alternative output representation is an image grid which is spatially shifted half a pixel across and half a pixel down, relative to the original image. Such a representation is known as a ![]() dual lattice. This does not actually localize the zero crossing any more accurately, of course.
dual lattice. This does not actually localize the zero crossing any more accurately, of course.
A more accurate approach is to perform some kind of interpolation to estimate the position of the zero crossing to ![]() sub-pixel precision.
sub-pixel precision.
![]()
Guidelines for Use
The behavior of the LoG zero crossing edge detector is largely governed by the standard deviation of the Gaussian used in the LoG filter. The higher this value is set, the more smaller features will be smoothed out of existence, and hence fewer zero crossings will be produced. Hence, this parameter can be set to remove unwanted detail or noise as desired. The idea that at different smoothing levels different sized features become prominent is referred to as `scale'.
We illustrate this effect using
which contains detail at a number of different scales.
The image
is the result of applying a LoG filter with Gaussian standard deviation 1.0. Note that in this and in the following LoG output images, the true output contains negative pixel values. For display purposes the graylevels have been offset so that displayed graylevel 128 corresponds to an actual value of zero, and rescaled to make the image variation clearer. Since we are only interested in zero crossings this rescaling is unimportant.
The image
shows the zero crossings from this image. Note the large number of minor features detected, which are mostly due to noise or very faint detail. This smoothing corresponds to a fine `scale'.
The image
is the result of applying a LoG filter with Gaussian standard deviation 2.0 and
shows the zero crossings. Note that there are far fewer detected crossings, and that those that remain are largely due to recognizable edges in the image. The thin vertical stripes on the wall, for example, are clearly visible.
Finally,
is the output from a LoG filter with Gaussian standard deviation 3.0. This corresponds to quite a coarse `scale'. The image
is the zero crossings in this image. Note how only the strongest contours remain, due to the heavy smoothing. In particular, note how the thin vertical stripes on the wall no longer give rise to many zero crossings.
All edges detected by the zero crossing detector are in the form of closed curves in the same way that contour lines on a map are always closed. The only exception to this is where the curve goes off the edge of the image.
Since the LoG filter is calculating a second derivative of the image, it is quite susceptible to noise, particularly if the standard deviation of the smoothing Gaussian is small. Thus it is common to see lots of spurious edges detected away from any obvious edges. One solution to this is to increase the smoothing of the Gaussian to preserve only strong edges. Another is to look at the gradient of the LoG at the zero crossing (i.e. the third derivative of the original image) and only keep zero crossings where this is above a certain threshold. This will tend to retain only the stronger edges, but it is sensitive to noise, since the third derivative will greatly amplify any high frequency noise in the image.
The image
is similar to the image obtained with a standard deviation of 1.0, except that the zero crossing detector has been told to ignore zero crossings of shallow slope (in fact it ignores zero crossings where the pixel value difference across the crossing in the LoG output is less than 40). As a result, fewer spurious zero crossings have been detected. Note that,in this case, the zero crossings do not necessarily form closed contours.
Marr (1982) has suggested that human visual systems use zero crossing detectors based on LoG filters at several different scales (Gaussian widths).
Interactive Experimentation
You can interactively experiment with this operator by clicking here.
Exercises
- Compare the output from the zero crossing edge detector with that from the Roberts Cross, Sobel and Canny edge detectors, for edge detection, noise rejection and edge localization.
- Take a simple image containing step edges such as

and see what happens to the locations of zero crossings as the level of smoothing is increased. Do they keep the same positions?
- Comment on the way in which zero crossings disappear as smoothing is increased.
- Try and develop an algorithm which can work out which side (positive or negative) of a particular discrete zero crossing is closer to the genuine zero crossing, and hence which should be marked as part of the zero crossing contour. Think about various possible 3×3 neighborhoods.
- Think of an interpolation method which would allow you to estimate the zero crossing location between two pixels to sub-pixel precision.
References
R. Gonzalez and R. Woods Digital Image Processing, Addison-Wesley Publishing Company, 1992, p 442.
D. Marr Vision, Freeman, 1982, pp 54 - 78.
D. Vernon Machine Vision, Prentice-Hall, 1991, Chap. 5.


