个人机器学习笔记之逻辑回归
吴恩达机器学习笔记(2)——Logitic 回归
机器学习个人笔记,学习中水平有限,内容如有缺漏还请多多包涵
Logictic回归是吴恩达课程的第7章,因为线性代数已经学过,而且主攻方向不是Octave,因此跳过了一些章节。目前实现了单,双变量的二分类逻辑回归,多分类的并未着手实现。
单变量,二分类的逻辑回归的python代码实现
import numpy as np
import matplotlib.pyplot as plt

def sigmoid(x):
    return 1/(1+np.exp(-x))

def h(x,pram):#假设函数,这里等价于y=sigmoid(θTX)
    temp=np.matmul(x,pram[1:].reshape(x.shape[1],1))+pram[0]
    return np.apply_along_axis(sigmoid, 0, temp)

def logictic(a,itertimes,datax,datay):#单变量梯度下降的逻辑回归
    #a:学习率
    #itertimes:迭代次数
    #datax:数据集中的自变量部分
    #datay:数据集中的结果部分
    m=datax.shape[0]#训练集长度
    pram=np.zeros(datax.shape[1]+1)#参数,初始化为0
    temppram=np.zeros(datax.shape[1]+1)#临时存储本次迭代的参数
    for i in range(0,itertimes):#迭代过程,执行itertimes次
        temppram[0]=pram[0]-a*np.sum(h(datax,pram)-datay)#对参数θ0进行迭代
        te=h(datax,pram)-datay.reshape(m,1)
        for j in range(1,pram.shape[0]):#对剩余参数进行迭代
            temppram[j]=pram[j]-a*np.sum((h(datax,pram)-datay.reshape(m,1)).reshape(1,m)*datax[...,j-1])
        if i%10==0:
            print("迭代",i)
            print( "参数:",pram)
            print("log误差:",np.sum(-datay*np.log(h(datax,pram))-(1-datay)*np.log(1-h(datax,pram))))#每十代输出一次误差
        pram=temppram
        pass
    return pram

x=np.array([range(1,11)]).T
print(x.shape[1])
y=np.array([[1,1,1,0,0,0,0,0,0,0]]).T
print(y.shape)
d=logictic(0.3, 1000, x, y)#执行逻辑回归算法,返回预测参数

drawx=np.array([range(0, 100)]).T
drawx=np.apply_along_axis(lambda x:x/10, 0, drawx)
plt.figure()
plt.scatter(x, y)#绘制数据集的散点图
plt.plot(drawx, h(drawx,d),color='red')#绘制预测值的曲线图
plt.show()
双变量,二分类的逻辑回归的python代码
import numpy as np
import matplotlib.pyplot as plt

def sigmoid(x):
    return 1/(1+np.exp(-x))

def h(x,pram):#假设函数,这里等价于y=sigmoid(θTX)
    temp=np.matmul(x,pram[1:].reshape(x.shape[1],1))+pram[0]
    return np.apply_along_axis(sigmoid, 0, temp)

def logictic(a,itertimes,datax,datay):#逻辑回归
    #a:学习率
    #itertimes:迭代次数
    #datax:数据集中的自变量部分
    #datay:数据集中的结果部分
    m=datax.shape[0]#训练集长度
    pram=np.zeros(datax.shape[1]+1)#参数,初始化为0
    temppram=np.zeros(datax.shape[1]+1)#临时存储本次迭代的参数
    for i in range(0,itertimes):#迭代过程,执行itertimes次
        temppram[0]=pram[0]-a*np.sum(h(datax,pram)-datay)#对参数theta0进行迭代
        te=h(datax,pram)-datay
        for j in range(1,pram.shape[0]):#对剩余参数进行迭代
            temppram[j]=pram[j]-a*np.sum((h(datax,pram)-datay).T*datax[...,j-1])
        if i%10==0:
            print("迭代",i)
            print( "参数:",pram)
            print("log误差:",np.sum(-datay*np.log(h(datax,pram))-(1-datay)*np.log(1-h(datax,pram))))#每十代输出误差
        pram=temppram
        pass
    return pram

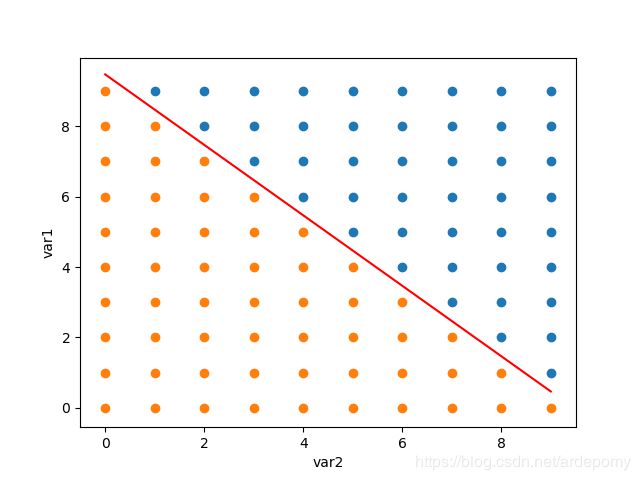
x=np.zeros([100,2])#在10*10的样本空间中做逻辑回归
for i in range(0,10):
    for j in range(0,10):
        x[i*10+j][0]=i
        x[i*10+j][1]=j
print(x.shape[1])

y=np.zeros([100,1])
for i in range(0,10):
    for j in range(0,10):
        if i+j-9>0:#数据集分类边界取直线y=-x+9
            y[i*10+j][0]=1

print(y.shape)
d=logictic(0.01, 500, x, y)#执行逻辑回归算法,返回分类边界线的参数

drawx=[]#设置用于绘图的坐标集合
drawy=[]
drawx1=[]
drawy1=[]
for i in range(0,100):
    if y[i]==1:#如果y中的第i个元素是1,则取出x中第i个样本作为坐标放入drawx列表
        drawx.append(x[i][0])
        drawy.append(x[i][1])
    else:#如果y中的第i个元素是0,则取出x中第i个样本作为坐标放入drawx1列表
        drawx1.append(x[i][0])
        drawy1.append(x[i][1])
plt.figure()
plt.scatter(drawx, drawy)#分别绘制数据集中drawx,drawx1两个分类的散点图
plt.scatter(drawx1, drawy1)
plt.plot(range(0,10), np.array(range(0,10))*-d[1]/d[2]-d[0]/d[2],color='red')#绘制分类线的图
plt.ylabel("var1")#注意不能设label为中文
plt.xlabel("var2")
plt.show()
实现过程记录
双变量逻辑回归的学习率要设置的比单变量时要低些,不然虽然可以计算出分类边界线的参数但计算log误差时会出现NAN值。
matplotlib设置图像的label为中文会出现乱码
公式部分
为了能在逻辑回归中继续使用梯度下降,我们定义了新的损失函数。
逻辑回归的损失函数定义为:
J ( θ ) = 1 m ∑ i = 0 m C o s t ( h θ ( x ( i ) ) − y ( i ) ) . J(\theta) =\frac{1}{m}\sum_{i=0}^m Cost(h_{\theta}(x^{(i)})-y^{(i)}). J(θ)=m1i=0∑mCost(hθ(x(i))−y(i)).
其中,Cost()函数部分定义为:
C o s t ( h θ ( x ( i ) ) − y ( i ) ) = − [ y ( i ) l o g h θ ( x ( i ) ) + ( 1 − y ( i ) ) l o g ( 1 − h θ ( x ( i ) ) ) ] . Cost(h_{\theta}(x^{(i)})-y^{(i)})= -[y^{(i)} log h_{\theta}(x^{(i)})+(1-y^{(i)})log(1-h_{\theta}(x^{(i)}))]. Cost(hθ(x(i))−y(i))=−[y(i)loghθ(x(i))+(1−y(i))log(1−hθ(x(i)))].
假设函数的新定义为:
h θ ( X ) = 1 1 + e − θ T X . h_\theta(X)=\frac{1}{1+e^{-\theta^{T}X}}. hθ(X)=1+e−θTX1.
个人认为引入sigmoid函数是为了加入分类所需的非线性特征
使用梯度下降的逻辑回归的迭代公式:
θ 0 = θ 0 − a ∗ ∑ i = 0 m ( h θ ( x ( i ) ) − y ( i ) ) . \theta_0 =\theta_0- a*\sum_{i=0}^m (h_{\theta}(x^{(i)})-y^{(i)}). θ0=θ0−a∗i=0∑m(hθ(x(i))−y(i)).
θ j = θ j − a ∗ ∑ i = 0 m ( h θ ( x ( i ) ) − y ( i ) ) ∗ x i . \theta_j =\theta_j- a*\sum_{i=0}^m (h_{\theta}(x^{(i)})-y^{(i)})*x^{i}. θj=θj−a∗i=0∑m(hθ(x(i))−y(i))∗xi.
学习视频:
逻辑回归.
其他笔记
- 机器学习入门
- 目录

