【Mask R-CNN】(十一):代码理解inspect_model.ipynb
一、导包
import os
import sys
import random
import math
import re
import time
import numpy as np
import tensorflow as tf
import matplotlib
import matplotlib.pyplot as plt
import matplotlib.patches as patches

#设置根目录
ROOT_DIR = os.path.abspath("../../")

#导入Mask RCNN
sys.path.append(ROOT_DIR)
from mrcnn import utils
from mrcnn import visualize
from mrcnn.visualize import display_images
import mrcnn.model as modellib
from mrcnn.model import log

%matplotlib inline

#保存log和model的目录
MODEL_DIR = os.path.join(ROOT_DIR, "logs")

#预训练权重文件的路径
COCO_MODEL_PATH = os.path.join(ROOT_DIR, "mask_rcnn_coco.h5")
#下载COCO预训练权重文件
if not os.path.exists(COCO_MODEL_PATH):
    utils.download_trained_weights(COCO_MODEL_PATH)

#Shapes数据集预训练权重文件的路径
SHAPES_MODEL_PATH = os.path.join(ROOT_DIR, "mask_rcnn_shapes.h5")
二、配置
#以下代码块二选其一即可

# Shapes toy数据集
# import shapes
# config = shapes.ShapesConfig()

# MS COCO数据集
import coco
config = coco.CocoConfig()
COCO_DIR = "path/to/COCO dataset"

#预测时,对训练时的配置做一些小的修改.
class InferenceConfig(config.__class__):
    # Run detection on one image at a time
    GPU_COUNT = 1
    IMAGES_PER_GPU = 1

config = InferenceConfig()
config.display()
三、Notebook Preferences
#选择加载神经网络的设备.
#当你同时在该设备上训练模型的时候这个参数就比较有用了
#你可以使用CPU,将GPU留作训练用
DEVICE = "/cpu:0"  # /cpu:0 or /gpu:0

#检查model是用于训练还是用于预测
#值: 'inference' 或 'training'
# TODO: 'training'测试模式的代码还没实现
TEST_MODE = "inference"

def get_ax(rows=1, cols=1, size=16):
    """返回一个在该notebook中用于所有可视化的Matplotlib Axes array。
    提供一个中央点坐标来控制graph的尺寸。

    调整attribute的尺寸来控制渲染多大的图像
    """
    _, ax = plt.subplots(rows, cols, figsize=(size*cols, size*rows))
    return ax
四、加载验证数据集
# 构造验证数据集
if config.NAME == 'shapes':
    dataset = shapes.ShapesDataset()
    dataset.load_shapes(500, config.IMAGE_SHAPE[0], config.IMAGE_SHAPE[1])
elif config.NAME == "coco":
    dataset = coco.CocoDataset()
    dataset.load_coco(COCO_DIR, "minival")

#在使用数据集之前必须调用下面的语句
dataset.prepare()

print("Images: {}\nClasses: {}".format(len(dataset.image_ids), dataset.class_names))
五、加载model
#创建一个用于预测的model
with tf.device(DEVICE):
    model = modellib.MaskRCNN(mode="inference", model_dir=MODEL_DIR,
                              config=config)

#设置weights文件路径
if config.NAME == "shapes":
    weights_path = SHAPES_MODEL_PATH
elif config.NAME == "coco":
    weights_path = COCO_MODEL_PATH
#或者取消下面的注释行,加载最近训练的模型
# weights_path = model.find_last()

#加载weights
print("Loading weights ", weights_path)
model.load_weights(weights_path, by_name=True)
六、运行检测
image_id = random.choice(dataset.image_ids)
image, image_meta, gt_class_id, gt_bbox, gt_mask =\
    modellib.load_image_gt(dataset, config, image_id, use_mini_mask=False)
info = dataset.image_info[image_id]
print("image ID: {}.{} ({}) {}".format(info["source"], info["id"], image_id,
                                       dataset.image_reference(image_id)))
#运行物体检测
results = model.detect([image], verbose=1)

#显示结果
ax = get_ax(1)
r = results[0]
visualize.display_instances(image, r['rois'], r['masks'], r['class_ids'],
                            dataset.class_names, r['scores'], ax=ax,
                            title="Predictions")
log("gt_class_id", gt_class_id)
log("gt_bbox", gt_bbox)
log("gt_mask", gt_mask)
image ID: coco.392144 (34940) http://cocodataset.org/#explore?id=392144
Processing 1 images
image                    shape: (1024, 1024, 3)       min:    0.00000  max:  255.00000
molded_images            shape: (1, 1024, 1024, 3)    min: -123.70000  max:  151.10000
image_metas              shape: (1, 89)               min:    0.00000  max: 1024.00000
gt_class_id              shape: (10,)                 min:    1.00000  max:   40.00000
gt_bbox                  shape: (10, 5)               min:    0.00000  max: 1024.00000
gt_mask                  shape: (1024, 1024, 10)      min:    0.00000  max:    1.00000
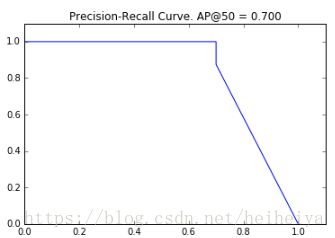
6.1 Precision-Recall
#画出precision-recall的曲线
AP, precisions, recalls, overlaps = utils.compute_ap(gt_bbox, gt_class_id, gt_mask,
                                          r['rois'], r['class_ids'], r['scores'], r['masks'])
visualize.plot_precision_recall(AP, precisions, recalls)

# 显示ground truth和预测的网格
visualize.plot_overlaps(gt_class_id, r['class_ids'], r['scores'],
                        overlaps, dataset.class_names)
6.2 计算mAP @ IoU=50
#计算VOC-style平均精度
def compute_batch_ap(image_ids):
    APs = []
    for image_id in image_ids:
        #加载图像
        image, image_meta, gt_class_id, gt_bbox, gt_mask =\
            modellib.load_image_gt(dataset, config,
                                   image_id, use_mini_mask=False)
        #运行物体检测
        results = model.detect([image], verbose=0)
        #计算AP
        r = results[0]
        AP, precisions, recalls, overlaps =\
            utils.compute_ap(gt_bbox, gt_class_id, gt_mask,
                              r['rois'], r['class_ids'], r['scores'], r['masks'])
        APs.append(AP)
    return APs

#随机选择一些图像
image_ids = np.random.choice(dataset.image_ids, 10)
APs = compute_batch_ap(image_ids)
print("mAP @ IoU=50: ", np.mean(APs))
七、详细的预测步骤
7.1 Region Proposal Network
Region Proposal Network(RPN)在图像的众多boxes(anchors)中运行一个轻量级的二值分类,并且返回是目标物体或者不是目标物体的分数。那些获得判断是目标物体的高分数anchors将会传递给下一阶段进行分类。
通常,即使是positive anchors也不会覆盖全部物体。所以RPN还会进行一个回归优化来获得更正确的边界,包括平移和缩放anchors。
7.1.1 RPN Targets
RPN targets是RPN的训练值。为了生成这些targets,我们用覆盖全图的不同尺度的anchors,然后计算这些anchors和ground truth的IoU。与ground truth的IoU>=0.7的认为是positive anchors,IoU<0.3的是negative anchors。IoU>=0.3并且IoU<0.7的是neutral anchors,将不会用于训练。
为了训练一个RPN regressor,我们还需要计算能使anchor完全覆盖ground truth的偏移和缩放量。
#生成RPN trainig targets
# target_rpn_match=1是positive anchors, -1是negative anchors
# 0是neutral anchors.
target_rpn_match, target_rpn_bbox = modellib.build_rpn_targets(
    image.shape, model.anchors, gt_class_id, gt_bbox, model.config)
log("target_rpn_match", target_rpn_match)
log("target_rpn_bbox", target_rpn_bbox)

positive_anchor_ix = np.where(target_rpn_match[:] == 1)[0]
negative_anchor_ix = np.where(target_rpn_match[:] == -1)[0]
neutral_anchor_ix = np.where(target_rpn_match[:] == 0)[0]
positive_anchors = model.anchors[positive_anchor_ix]
negative_anchors = model.anchors[negative_anchor_ix]
neutral_anchors = model.anchors[neutral_anchor_ix]
log("positive_anchors", positive_anchors)
log("negative_anchors", negative_anchors)
log("neutral anchors", neutral_anchors)

#将refinement deltas应用于positive anchors
refined_anchors = utils.apply_box_deltas(
    positive_anchors,
    target_rpn_bbox[:positive_anchors.shape[0]] * model.config.RPN_BBOX_STD_DEV)
log("refined_anchors", refined_anchors, )

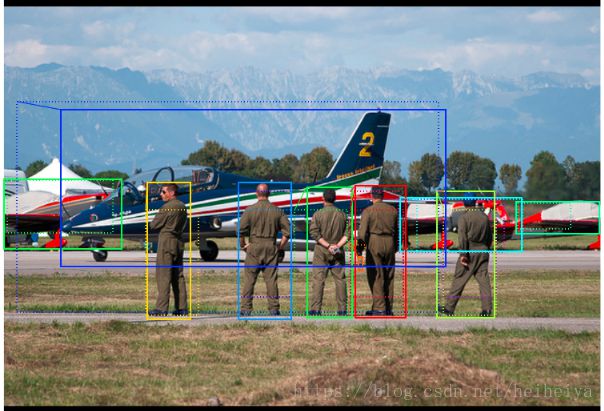
#显示refinement (点)之前的positive anchors和refinement (线)之后的positive anchors.
visualize.draw_boxes(image, boxes=positive_anchors, refined_boxes=refined_anchors, ax=get_ax())
target_rpn_match         shape: (65472,)              min:   -1.00000  max:    1.00000
target_rpn_bbox          shape: (256, 4)              min:   -5.19860  max:    2.59641
positive_anchors         shape: (14, 4)               min:    5.49033  max:  973.25483
negative_anchors         shape: (242, 4)              min:  -22.62742  max: 1038.62742
neutral anchors          shape: (65216, 4)            min: -362.03867  max: 1258.03867
refined_anchors          shape: (14, 4)               min:    0.00000  max: 1023.99994
7.1.2 RPN预测
#运行RPN sub-graph
pillar = model.keras_model.get_layer("ROI").output  # node to start searching from

nms_node = model.ancestor(pillar, "ROI/rpn_non_max_suppression:0")
if nms_node is None:
    nms_node = model.ancestor(pillar, "ROI/rpn_non_max_suppression/NonMaxSuppressionV2:0")

rpn = model.run_graph([image], [
    ("rpn_class", model.keras_model.get_layer("rpn_class").output),
    ("pre_nms_anchors", model.ancestor(pillar, "ROI/pre_nms_anchors:0")),
    ("refined_anchors", model.ancestor(pillar, "ROI/refined_anchors:0")),
    ("refined_anchors_clipped", model.ancestor(pillar, "ROI/refined_anchors_clipped:0")),
    ("post_nms_anchor_ix", nms_node),
    ("proposals", model.keras_model.get_layer("ROI").output),
])

#显示得分较高的anchors(refinement之前)
limit = 100
sorted_anchor_ids = np.argsort(rpn['rpn_class'][:,:,1].flatten())[::-1]
visualize.draw_boxes(image, boxes=model.anchors[sorted_anchor_ids[:limit]], ax=get_ax())

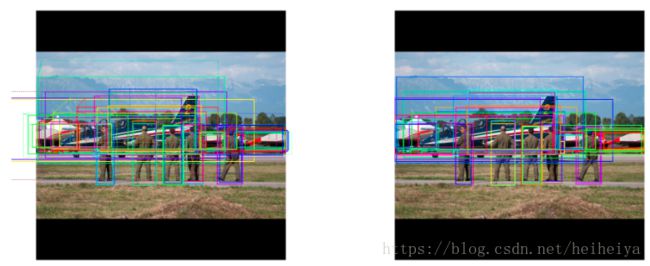
#显示refinement之后的anchors.之后将超出图像边界的裁剪掉
limit = 50
ax = get_ax(1, 2)
visualize.draw_boxes(image, boxes=rpn["pre_nms_anchors"][0, :limit],
           refined_boxes=rpn["refined_anchors"][0, :limit], ax=ax[0])
visualize.draw_boxes(image, refined_boxes=rpn["refined_anchors_clipped"][0, :limit], ax=ax[1])

#显示NMS优化后的anchors
limit = 50
ixs = rpn["post_nms_anchor_ix"][:limit]
visualize.draw_boxes(image, refined_boxes=rpn["refined_anchors_clipped"][0, ixs], ax=get_ax())

#显示最终的proposals
#这和前一步的结果一样(NMS优化), 但是将坐标规范化到[0, 1].
limit = 50
#显示之后转化回图像坐标
h, w = config.IMAGE_SHAPE[:2]
proposals = rpn['proposals'][0, :limit] * np.array([h, w, h, w])
visualize.draw_boxes(image, refined_boxes=proposals, ax=get_ax())
#测试RPN recall (被anchors覆盖的物体的比例)
#这里我们用三种不同的方法测试recall:
# - 全部anchors
# - 所有refined anchors
# - NMS之后的Refined anchors
iou_threshold = 0.7

recall, positive_anchor_ids = utils.compute_recall(model.anchors, gt_bbox, iou_threshold)
print("All Anchors ({:5})       Recall: {:.3f}  Positive anchors: {}".format(
    model.anchors.shape[0], recall, len(positive_anchor_ids)))

recall, positive_anchor_ids = utils.compute_recall(rpn['refined_anchors'][0], gt_bbox, iou_threshold)
print("Refined Anchors ({:5})   Recall: {:.3f}  Positive anchors: {}".format(
    rpn['refined_anchors'].shape[1], recall, len(positive_anchor_ids)))

recall, positive_anchor_ids = utils.compute_recall(proposals, gt_bbox, iou_threshold)
print("Post NMS Anchors ({:5})  Recall: {:.3f}  Positive anchors: {}".format(
    proposals.shape[0], recall, len(positive_anchor_ids)))
All Anchors (65472)       Recall: 0.400  Positive anchors: 8
Refined Anchors (10000)   Recall: 0.900  Positive anchors: 65
Post NMS Anchors (   50)  Recall: 0.800  Positive anchors: 9
7.2 Proposal分类
7.2.1 Proposal Classification
运行分类器以产生分类概率和bounding box回归。
#获取classifier和mask的输入和输出.
mrcnn = model.run_graph([image], [
    ("proposals", model.keras_model.get_layer("ROI").output),
    ("probs", model.keras_model.get_layer("mrcnn_class").output),
    ("deltas", model.keras_model.get_layer("mrcnn_bbox").output),
    ("masks", model.keras_model.get_layer("mrcnn_mask").output),
    ("detections", model.keras_model.get_layer("mrcnn_detection").output),
])

#获取检测的class IDs.修剪zero padding.
det_class_ids = mrcnn['detections'][0, :, 4].astype(np.int32)
det_count = np.where(det_class_ids == 0)[0][0]
det_class_ids = det_class_ids[:det_count]
detections = mrcnn['detections'][0, :det_count]

print("{} detections: {}".format(
    det_count, np.array(dataset.class_names)[det_class_ids]))

captions = ["{} {:.3f}".format(dataset.class_names[int(c)], s) if c > 0 else ""
            for c, s in zip(detections[:, 4], detections[:, 5])]
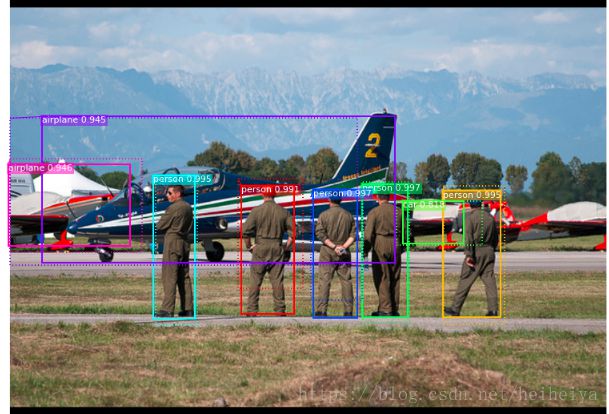
visualize.draw_boxes(
    image,
    refined_boxes=utils.denorm_boxes(detections[:, :4], image.shape[:2]),
    visibilities=[2] * len(detections),
    captions=captions, title="Detections",
    ax=get_ax())
7.2.2 检测的步骤
# Proposals的坐标是规范化的坐标. 将它们缩放到图像坐标.
h, w = config.IMAGE_SHAPE[:2]
proposals = np.around(mrcnn["proposals"][0] * np.array([h, w, h, w])).astype(np.int32)

# 每个proposal的Class ID, score, and mask
roi_class_ids = np.argmax(mrcnn["probs"][0], axis=1)
roi_scores = mrcnn["probs"][0, np.arange(roi_class_ids.shape[0]), roi_class_ids]
roi_class_names = np.array(dataset.class_names)[roi_class_ids]
roi_positive_ixs = np.where(roi_class_ids > 0)[0]

#有多少ROIs和空行?
print("{} Valid proposals out of {}".format(np.sum(np.any(proposals, axis=1)), proposals.shape[0]))
print("{} Positive ROIs".format(len(roi_positive_ixs)))

# Class数量
print(list(zip(*np.unique(roi_class_names, return_counts=True))))

#显示一个随机样本的proposals.
#分类为背景的Proposals是点,其他的显示它们的类名和置信分数.
limit = 200
ixs = np.random.randint(0, proposals.shape[0], limit)
captions = ["{} {:.3f}".format(dataset.class_names[c], s) if c > 0 else ""
            for c, s in zip(roi_class_ids[ixs], roi_scores[ixs])]
visualize.draw_boxes(image, boxes=proposals[ixs],
                     visibilities=np.where(roi_class_ids[ixs] > 0, 2, 1),
                     captions=captions, title="ROIs Before Refinement",
                     ax=get_ax())
应用bounding box优化。
#指定类别的bounding box偏移.
roi_bbox_specific = mrcnn["deltas"][0, np.arange(proposals.shape[0]), roi_class_ids]
log("roi_bbox_specific", roi_bbox_specific)

#应用bounding box变换
#形状: [N, (y1, x1, y2, x2)]
refined_proposals = utils.apply_box_deltas(
    proposals, roi_bbox_specific * config.BBOX_STD_DEV).astype(np.int32)
log("refined_proposals", refined_proposals)

#显示positive proposals
# ids = np.arange(roi_boxes.shape[0])  #显示所有
limit = 5
ids = np.random.randint(0, len(roi_positive_ixs), limit)  #随机显示样本
captions = ["{} {:.3f}".format(dataset.class_names[c], s) if c > 0 else ""
            for c, s in zip(roi_class_ids[roi_positive_ixs][ids], roi_scores[roi_positive_ixs][ids])]
visualize.draw_boxes(image, boxes=proposals[roi_positive_ixs][ids],
                     refined_boxes=refined_proposals[roi_positive_ixs][ids],
                     visibilities=np.where(roi_class_ids[roi_positive_ixs][ids] > 0, 1, 0),
                     captions=captions, title="ROIs After Refinement",
                     ax=get_ax())
roi_bbox_specific        shape: (1000, 4)             min:   -2.44748  max:    2.94838
refined_proposals        shape: (1000, 4)             min:   -8.00000  max: 1028.00000
过滤掉低置信度的检测结果。
#去掉那些被分类为背景的boxes
keep = np.where(roi_class_ids > 0)[0]
print("Keep {} detections:\n{}".format(keep.shape[0], keep))

#去掉低置信度的检测结果
keep = np.intersect1d(keep, np.where(roi_scores >= config.DETECTION_MIN_CONFIDENCE)[0])
print("Remove boxes below {} confidence. Keep {}:\n{}".format(
    config.DETECTION_MIN_CONFIDENCE, keep.shape[0], keep))
为每一个类别做NMS。
#为每一个类别做NMS
pre_nms_boxes = refined_proposals[keep]
pre_nms_scores = roi_scores[keep]
pre_nms_class_ids = roi_class_ids[keep]

nms_keep = []
for class_id in np.unique(pre_nms_class_ids):
    #选择该类的检测结果
    ixs = np.where(pre_nms_class_ids == class_id)[0]
    #做NMS
    class_keep = utils.non_max_suppression(pre_nms_boxes[ixs],
                                            pre_nms_scores[ixs],
                                            config.DETECTION_NMS_THRESHOLD)
    #映射索引
    class_keep = keep[ixs[class_keep]]
    nms_keep = np.union1d(nms_keep, class_keep)
    print("{:22}: {} -> {}".format(dataset.class_names[class_id][:20],
                                   keep[ixs], class_keep))

keep = np.intersect1d(keep, nms_keep).astype(np.int32)
print("\nKept after per-class NMS: {}\n{}".format(keep.shape[0], keep))

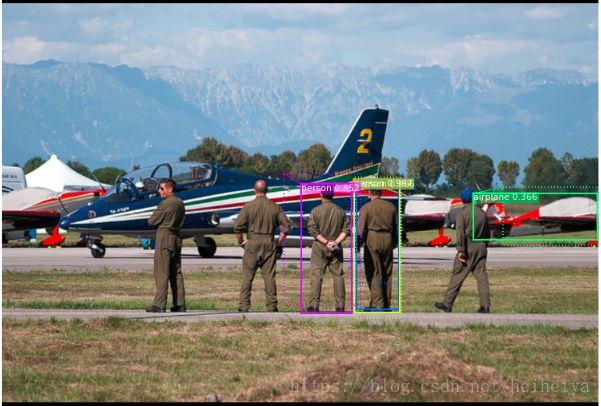
#显示最终的检测结果
ixs = np.arange(len(keep))  # Display all
# ixs = np.random.randint(0, len(keep), 10)  # Display random sample
captions = ["{} {:.3f}".format(dataset.class_names[c], s) if c > 0 else ""
            for c, s in zip(roi_class_ids[keep][ixs], roi_scores[keep][ixs])]
visualize.draw_boxes(
    image, boxes=proposals[keep][ixs],
    refined_boxes=refined_proposals[keep][ixs],
    visibilities=np.where(roi_class_ids[keep][ixs] > 0, 1, 0),
    captions=captions, title="Detections after NMS",
    ax=get_ax())
7.3 生成masks
这一步从上一层获取检测结果,并且运行mask分支来生成每一个instance的分割masks。
7.3.1 Mask Targets
display_images(np.transpose(gt_mask, [2, 0, 1]), cmap="Blues")
7.3.2 预测的masks
#获取mask分支的预测结果
mrcnn = model.run_graph([image], [
    ("detections", model.keras_model.get_layer("mrcnn_detection").output),
    ("masks", model.keras_model.get_layer("mrcnn_mask").output),
])

#获取检测结果的class IDs.修剪zero padding.
det_class_ids = mrcnn['detections'][0, :, 4].astype(np.int32)
det_count = np.where(det_class_ids == 0)[0][0]
det_class_ids = det_class_ids[:det_count]

print("{} detections: {}".format(
    det_count, np.array(dataset.class_names)[det_class_ids]))

# Masks
det_boxes = utils.denorm_boxes(mrcnn["detections"][0, :, :4], image.shape[:2])
det_mask_specific = np.array([mrcnn["masks"][0, i, :, :, c]
                              for i, c in enumerate(det_class_ids)])
det_masks = np.array([utils.unmold_mask(m, det_boxes[i], image.shape)
                      for i, m in enumerate(det_mask_specific)])
log("det_mask_specific", det_mask_specific)
log("det_masks", det_masks)

display_images(det_mask_specific[:4] * 255, cmap="Blues", interpolation="none")

display_images(det_masks[:4] * 255, cmap="Blues", interpolation="none")
可视化Activations。有助于观察不同layers。
#获取一些示例层的activations
activations = model.run_graph([image], [
    ("input_image",        model.keras_model.get_layer("input_image").output),
    ("res4w_out",          model.keras_model.get_layer("res4w_out").output),  # for resnet100
    ("rpn_bbox",           model.keras_model.get_layer("rpn_bbox").output),
    ("roi",                model.keras_model.get_layer("ROI").output),
])

#输入图像 (规范化的)
_ = plt.imshow(modellib.unmold_image(activations["input_image"][0],config))

# Backbone feature map
display_images(np.transpose(activations["res4w_out"][0,:,:,:4], [2, 0, 1]))
#显示RPN bounding box deltas的直方图
plt.figure(figsize=(12, 3))
plt.subplot(1, 4, 1)
plt.title("dy")
_ = plt.hist(activations["rpn_bbox"][0,:,0], 50)
plt.subplot(1, 4, 2)
plt.title("dx")
_ = plt.hist(activations["rpn_bbox"][0,:,1], 50)
plt.subplot(1, 4, 3)
plt.title("dw")
_ = plt.hist(activations["rpn_bbox"][0,:,2], 50)
plt.subplot(1, 4, 4)
plt.title("dh")
_ = plt.hist(activations["rpn_bbox"][0,:,3], 50)
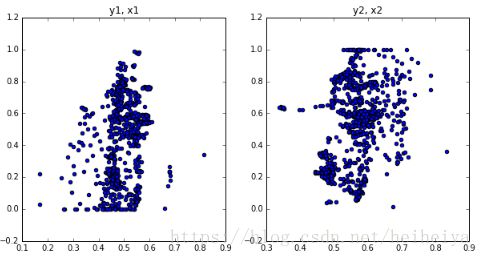
# 显示生成的proposals的y,x坐标的分布
plt.figure(figsize=(10, 5))
plt.subplot(1, 2, 1)
plt.title("y1, x1")
plt.scatter(activations["roi"][0,:,0], activations["roi"][0,:,1])
plt.subplot(1, 2, 2)
plt.title("y2, x2")
plt.scatter(activations["roi"][0,:,2], activations["roi"][0,:,3])
plt.show()

