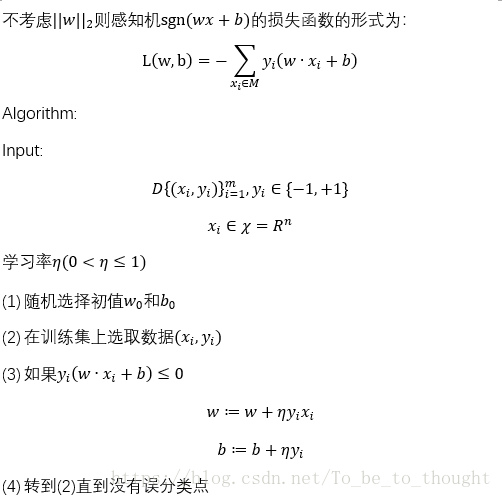
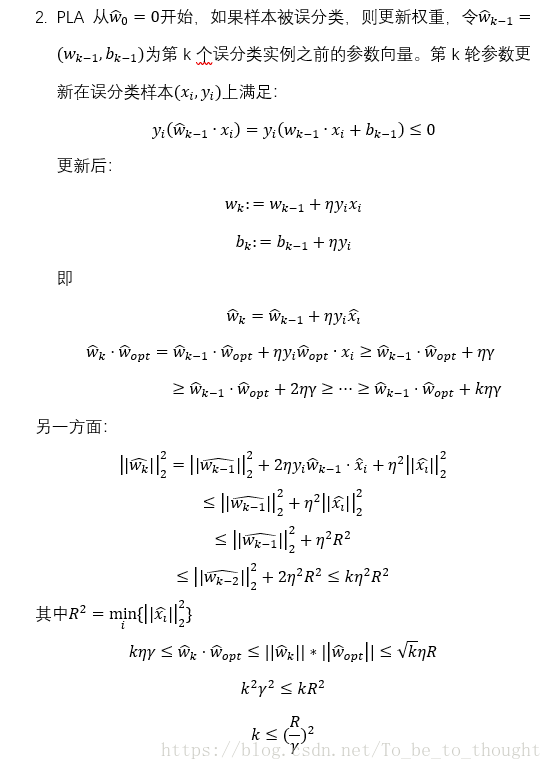
感知机算法(Perceptron Learning Algorithm)和代码实现(Python)
PLA算法是机器学习中最为基础的算法,与SVM和Neural Network有着紧密的关系。
import numpy as np
import matplotlib.pyplot as plt
import matplotlib.animation as animation

#感知机学习算法
def Percetron_Learning(X,y,learning_rate):
    m,n=X.shape
    w_record=[]
    X=np.column_stack((X,np.ones(m)))
    w=np.random.random(n+1)
    w_record.append(w.copy())
    iter=0
    while True:
        i=np.random.randint(m)
        if y[i]*(w.dot(X[i,:]))<=0:
            w=w+learning_rate*y[i]*X[i,:]
            w_record.append(w.copy())
            iter+=1
            print("第"+str(iter)+"次修正")
            continue
        predict=sgn(X,w)
        if np.all(predict==y):
            break
    return w,w_record

#指示函数
def sgn(X,w):
    predict=np.dot(X,w)
    predict[predict>0]=1
    predict[predict<0]=-1
    predict[predict==0]=0
    return predict


#二维测试数据生成
mean1=[0,0]
cov1=[[1,0],[0,1]]
mean2=[3,3]
cov2=[[1,0],[0,1]]
X1=np.random.multivariate_normal(mean1,cov1,50)
X2=np.random.multivariate_normal(mean2,cov2,50)
#绘制散点图
plt.scatter(X1[:,0],X1[:,1])
plt.scatter(X2[:,0],X2[:,1])
#PLA算法求系数
X = np.row_stack((X1,X2))
y = np.ones(100)
y[0:50] = -1
w,w_record = Percetron_Learning(X,y,0.01)

fig, ax = plt.subplots()
ax.scatter(X1[:,0],X1[:,1])
ax.scatter(X2[:,0],X2[:,1])
x = np.arange(X.min()-1,X.max()+1,0.01)
w0 = w_record[0]
line, = ax.plot(x, (-w0[0]*x-w0[2])/w0[1])

def init():  # only required for blitting to give a clean slate.
    line.set_ydata([np.nan] * len(x))
    return line,

def animate(i):
    if i == len(w_record):
        return
    w = w_record[i]
    line.set_ydata((-w[0]*x-w[2])/w[1])  # update the data.
    return line,

ani = animation.FuncAnimation(fig, animate, init_func=init, interval=2, blit=True, save_count=50)
ax.plot(x,(-w[0]*x-w[2])/w[1])
核心代码比较简单,后面是绘制算法在模拟数据上学习过程动画的代码。
参考文献:李航《统计学习方法》


