感知机算法原始形式与对偶形式的python实现
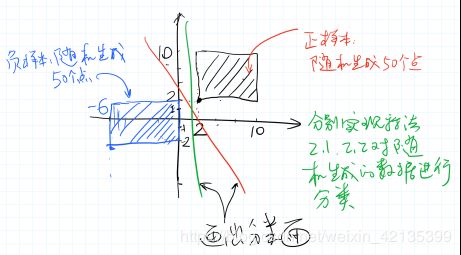
如上图所示,在[2,10]x[2,10]的矩形区域内随机生成50个点作为正样本,在[-6,0]x[-2,2]的矩形区域内随机生成50个点作为负样本。要求:
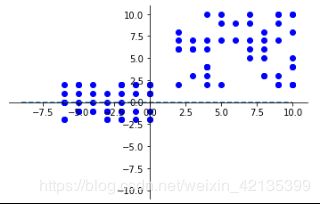
1.把生成的点画在图上;
解:
虚线表示初始化时的分类面。
2.分别用李航《统计学习方法》课本中的算法2.1和算法2.2求解w和b,并将最终的分类面画在图上;
解:
第一次分类结果:
| 分类结果一 |
|
| 算法2.1求解结果 |
算法2.2求解结果 |
| w0[0] = 0.400000 |
w1[0] = 0.080000 |
| w0[1] = -0.000000 |
w1[1] = 0.000000 |
| b0 = -0.150000 |
b1 = -0.030000 |
可知这表示同一条直线。
不同的初值会产生不同的分类面,下为第二次分割结果:
| 分类结果二 |
|
| 算法2.1求解结果 |
算法2.2求解结果 |
| w0[0] = 0.300000 |
w1[0] = 0.060000 |
| w0[1] = 0.100000 |
w1[1] = 0.010000 |
| b0 = -0.250000 |
b1 = -0.060000 |
3.分析不同的学习率对算法收敛性的影响。
解:当数据集线性可分时,感知机学习算法是收敛的。学习率太小,收敛的会很慢;学习率过大,会产生震荡,但只要继续执行梯度下降算法进行学习,最终算法一定会收敛。也就是老师讲的”知错就改”,一直改下去就能正确分类。
小结:
(1)感知机学习算法由于采用不同的初值或选取不同的误分类点,会对解产生影响。
(2)感知机的对偶形式,就是用α去记录每个yixi要加多少次,最后一次加上去。对偶形式和原始形式并没有本质区别。在对偶形式中,训练实例仅以内积的形式出现,如果预先将训练集中的实例间的内积计算出来并以矩阵的形式存储,可以加快计算速度。
附代码:
import matplotlib.pyplot as plt
import numpy as np
import random
x0 = np.linspace(-9, 10)
y0 = 0 * x0
u = 10*np.cos(x0)
data=[(random.randint(2,10), random.randint(2,10)) for i in range(0,50,1)] #生成随即点
data=np.array(data, dtype = int)
x=data[:,0]
y=data[:,1]
data1=[(random.randint(-6,0), random.randint(-2,2)) for i in range(0,50,1)]
data1=np.array(data1, dtype = int)
x1=data1[:,0]
y1=data1[:,1]
T=np.vstack((data,data1))#合并数据集
plt.figure()

ax = plt.gca() # get current axis 获得坐标轴对象
ax.spines['right'].set_color('none')
ax.spines['top'].set_color('none') # 将右边 上边的两条边颜色设置为空 其实就相当于抹掉这两条边
ax.xaxis.set_ticks_position('bottom')
ax.yaxis.set_ticks_position('left') # 指定下边的边作为 x 轴 指定左边的边为 y 轴
ax.spines['bottom'].set_position(('data', 0)) #指定 data 设置的bottom(也就是指定的x轴)绑定到y轴的0这个点上
ax.spines['left'].set_position(('data', 0))
xlim(right=10) # adjust the max leaving min unchanged
xlim(left=9) # adjust the min leaving max unchanged
plt.xlim(x0.min() * 1.1, x0.max() * 1.1)
ylim(top=10) # adjust the max leaving min unchanged
ylim(bottom=9) # adjust the min leaving max unchanged
plt.ylim(u.min() * 1.1, u.max() * 1.1)

plt.plot(x0, y0, linestyle='--')
#plt.plot(x0, u, linestyle='--')
plt.scatter(x,y,color='b')
plt.scatter(x1,y1,color='b')
plt.show()

label=np.ones((50,1))#生成正标签1
label1=np.zeros((50,1))#生成负标签-1
#print(label)
for i in range(0,50):
    label1[i,0]=-1
Label=np.vstack((label,label1))#合并标签集
#print(Label)
def algorithm1(T,Label,lr=0.05):
w0=np.array([0,0])
b0=0
for i in range(0,100):
if(Label[i,:]*(np.dot(w0,T[i,:])+b0)<=0):
w0=w0+lr* Label[i,:]*T[i,:]
b0=b0+lr* Label[i,:]
#print(i)
return w0,b0
w0,b0=algorithm1(T,Label)
print("w0[0] = %f" % (w0[0]))
print("w0[1] = %f" % (w0[1]))
print("b0 = %f" % (b0))
x0 = np.linspace(-9, 10)
y0 = 0 * x0
y2 =(-w0[0]*x0-b0[0])/(w0[1]+0.000001)
u = 10*np.cos(x0)
plt.figure()

ax = plt.gca() # get current axis 获得坐标轴对象
ax.spines['right'].set_color('none')
ax.spines['top'].set_color('none') # 将右边 上边的两条边颜色设置为空 其实就相当于抹掉这两条边
ax.xaxis.set_ticks_position('bottom')
ax.yaxis.set_ticks_position('left') # 指定下边的边作为 x 轴 指定左边的边为 y 轴
ax.spines['bottom'].set_position(('data', 0)) #指定 data 设置的bottom(也就是指定的x轴)绑定到y轴的0这个点上
ax.spines['left'].set_position(('data', 0))

xlim(right=10) # adjust the max leaving min unchanged
xlim(left=9) # adjust the min leaving max unchanged
plt.xlim(x0.min() * 1.1, x0.max() * 1.1)
ylim(top=10) # adjust the max leaving min unchanged
ylim(bottom=9) # adjust the min leaving max unchanged
plt.ylim(u.min() * 1.1, u.max() * 1.1)
plt.plot(x0, y0, linestyle='--')
plt.scatter(x,y,color='b')
plt.scatter(x1,y1,color='b')

plt.plot(x0, y2, linestyle='--')
plt.show()
def algorithm2(T,Label,lr=0.01):
alpha=np.zeros(100,np.float)
b0=0
Gram=np.dot(T,T.T)
for i in range(len(T)):
temp=0
for j in range(0,100):
temp+=alpha[j]*Label[j,:]*Gram[i][j]
temp+=b0
if(Label[i,:]*temp<=0):
alpha[i]=alpha[i]+lr
b0=b0+lr * Label[i,:]
#print(i)
return alpha,b0
alpha,b1=algorithm2(T,Label)
w1=0
for i in range(len(alpha)):
    w1+=alpha[i]*Label[i,:]*T[i,:]
    #print(alpha[i])
#print(w0)
print("w1[0] = %f" % (w1[0]))
print("w1[1] = %f" % (w1[1]))
print("b1 = %f" % (b1))
x0 = np.linspace(-9, 10)
y3 =(-w1[0]*x0-b1[0])/(w1[1]+0.000001)
y2 =(-w0[0]*x0-b0[0])/(w0[1]+0.000001)
u = 10*np.cos(x0)
plt.figure()

ax = plt.gca() # get current axis 获得坐标轴对象
ax.spines['right'].set_color('none')
ax.spines['top'].set_color('none') # 将右边 上边的两条边颜色设置为空 其实就相当于抹掉这两条边
ax.xaxis.set_ticks_position('bottom')
ax.yaxis.set_ticks_position('left') # 指定下边的边作为 x 轴 指定左边的边为 y 轴
ax.spines['bottom'].set_position(('data', 0)) #指定 data 设置的bottom(也就是指定的x轴)绑定到y轴的0这个点上
ax.spines['left'].set_position(('data', 0))

xlim(right=10) # adjust the max leaving min unchanged
xlim(left=9) # adjust the min leaving max unchanged
plt.xlim(x0.min() * 1.1, x0.max() * 1.1)
ylim(top=10) # adjust the max leaving min unchanged
ylim(bottom=9) # adjust the min leaving max unchanged
plt.ylim(u.min() * 1.1, u.max() * 1.1)

plt.plot(x0, y3, linestyle='--')
plt.scatter(x,y,color='b')
plt.scatter(x1,y1,color='b')
plt.plot(x0, y2, linestyle='--')

plt.show()


