R语言:画树图
原始数据长这样:
“iyear”表示年份;“nkill”表示死亡人数;“region”表示地区;“总计”表示某年份死亡总人数;nkii里的缺失数据自动按“0”运算。
数据存储在名为“ljs”的csv格式里。
应提前下载好treemap包,先介绍treemap函数的用法:
treemap(dtf, index, vSize, vColor = NULL, stdErr = NULL...)
dtf :a data.frame. Required.
index:
vector of column names in dtf that specify the aggregation indices. It could contain only one column name, which results in a treemap without hierarchy. If multiple column names are provided, the first name is the highest aggregation level, the second name the second-highest aggregation level, and so on. Required.
(指定聚合索引的dtf中列名的向量。它只能包含一个列名,这会导致一个没有层次结构的treemap。如果提供了多个列名,则第一个列名是最高的聚合级别,第二个列名是次高聚合级别,依此类推。必需的。)
vSize :name of the column in dtf that specifies the sizes of the rectangles. Required. (指定矩形大小的dtf列的名称。)
vColor :name of the column that, in combination with type, determines the colors of the rectangles. The variable can be scaled by the addition of "*
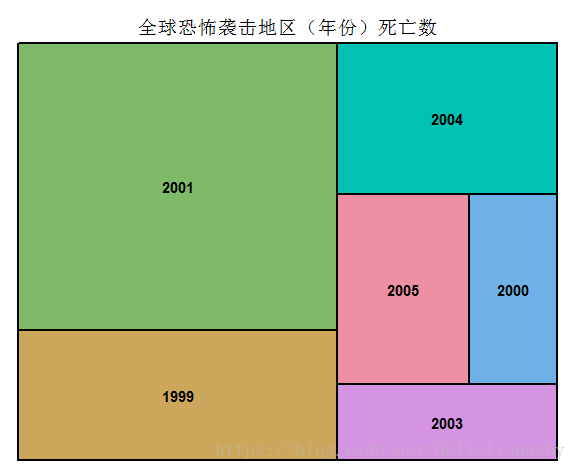
(1)按年份画树图:
mydata<-read.table("ljs.csv",header=TRUE,sep=",")
library(dplyr)
library(treemap)
treemap(mydata,index=c("iyear"),vSize = "nkill",title = "全球恐怖袭击地区(年份)死亡数")
输出结果:
(2)按地区画数图:
mydata<-read.table("ljs.csv",header=TRUE,sep=",")
library(dplyr)
library(treemap)
treemap(mydata,index=c("region"),vSize = "nkill",title = "全球恐怖袭击地区死亡数")
#将index里的“iyear”换成“region”即可
输出结果:(按地区统计死亡人数并画图)
(3)按年份和地区(index里“先地区后年份”)画图:
mydata<-read.table("ljs.csv",header=TRUE,sep=",")
library(dplyr)
library(treemap)
treemap(mydata,index=c("region","iyear"),vSize = "nkill",title = "全球恐怖袭击地区死亡数")
输出结果:
(4)按年份和地区(index里“先年份后地区”)画图:
mydata<-read.table("ljs.csv",header=TRUE,sep=",")
library(dplyr)
library(treemap)
treemap(mydata,index=c("iyear","region"),vSize = "nkill",title = "全球恐怖袭击地区死亡数")
输出结果:
2004年份里Southeast Asia有3人,South Asia有1人。


