机器学习3——多类分类和神经网络
本篇博客主要讲解,吴恩达机器学习第四周的编程作业,作业内容主要是对手写数字进行识别,是一个十分类问题,要求使用两种不同的方法实现:一是用之前讲过的逻辑回归实现手写数字识别,二是用本周讲的神经网络实现手写数字识别。实验的原始版本是用Matlab实现的,本篇主要用Python来实现。
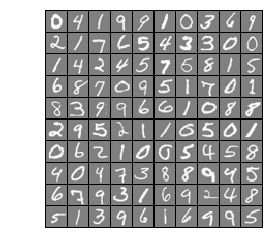
在ex3data1.mat中有5000个训练示例,其中每个训练示例是一个20像素乘20像素的数字灰度图像。每个像素都由一个浮点数表示,该浮点数指示那个地方的灰度强度。20×20像素网格被“展开”成400维向量。这些培训示例中的每一个都成为数据矩阵X中的一行。5000×400矩阵X,其中每一行都是训练手写数字映像的例子。训练集的第二部分是包含训练集标签的5000维向量y。在没有零索引的情况下,w我们已经把数字零减到10了。因此,“0”数字被标记为“10”,而数字“1”到“9”则被标记为“1”到“9”。
一、逻辑回归实现手写数字识别
1.1数据的可视化
import matplotlib.pyplot as plt
import numpy as np
import scipy.io as scio      #引入读取.mat文件的库

plt.ion()

input_layer_size=400    #输入特征的维度 每张数字图片20*20=400
num_labels=10          #10个标签 注意“0”对应第十个标签   1-9一次对应第1-9个标签
data=scio.loadmat('ex3data1.mat')#读取训练集 包括两部分 输入特征和标签
X=data['X']#提取输入特征 5000*400的矩阵  5000个训练样本 每个样本特征维度为400 一行代表一个训练样本
y=data['y'].flatten() #提取标签 data['y']是一个5000*1的2维数组 利用flatten()将其转换为有5000个元素的一维数组

'''-----------------可视化数据集的程序--------------------'''

def display_data(x):
    (m, n) = x.shape   #100*400

    example_width = np.round(np.sqrt(n)).astype(int) #每个样本显示宽度 round()四舍五入到个位 并转换为int
    example_height = (n / example_width).astype(int) #每个样本显示高度  并转换为int

    #设置显示格式 100个样本 分10行 10列显示
    display_rows = np.floor(np.sqrt(m)).astype(int)#floor(x),其功能是“向下取整”,下取整是直接去掉小数部分。
    display_cols = np.ceil(m / display_rows).astype(int)#ceil(x),其功能是向上取整。

    # 待显示的每张图片之间的间隔
    pad = 1

    # 显示的布局矩阵 初始化值为-1
    display_array = - np.ones((pad + display_rows * (example_height + pad),
                              pad + display_rows * (example_height + pad)))

    # Copy each example into a patch on the display array
    curr_ex = 0
    for j in range(display_rows):
        for i in range(display_cols):
            if curr_ex > m:
                break

            # Copy the patch
            # Get the max value of the patch
            max_val = np.max(np.abs(x[curr_ex]))
            display_array[pad + j * (example_height + pad) + np.arange(example_height),
                          pad + i * (example_width + pad) + np.arange(example_width)[:, np.newaxis]] = \
                          x[curr_ex].reshape((example_height, example_width)) / max_val
            curr_ex += 1

        if curr_ex > m:
            break

    # 显示图片
    plt.figure()
    plt.imshow(display_array, cmap='gray', extent=[-1, 1, -1, 1])
    plt.axis('off')

'''---------------------------------------------------------'''

m = y.size  #训练样本的数量

# 随机抽取100个训练样本 进行可视化
rand_indices = np.random.permutation(range(m)) #获取0-4999 5000个无序随机索引
selected = X[rand_indices[0:100], :]  #获取前100个随机索引对应的整条数据的输入特征

display_data(selected)   #调用可视化函数 进行可视化
运行结果:

1.2 逻辑回归的代价函数(正则化)
向量化正则Logistic回归:

请注意,不应该对θ0进行正则化。
#sigmoid函数
def sigmoid(z):
    return 1/(1+np.exp(-z))

#逻辑回归的假设函数
def h(X,theta):
    return sigmoid(np.dot(X,theta))##X: m*(n+1)  theta:(n+1,) 内积返回结果(m*1,)

#计算代价函数
def compute_cost(theta,X,y,lmd):
    m=y.size#样本数
    cost=0
    myh=h(X,theta)#得到假设函数

    term1=-y.dot(np.log(myh))#y:(m*1,)   log(myh):(m*1,)  得到一个数值
    term2=(1-y).dot(np.log(1-myh))#1-y:(m*1,)   log(1-myh):(m*1,) 得到一个数值
    term3=theta[1:].dot(theta[1:])*lmd    #正则化项 注意不惩罚theta0 得到一个数值 thrta[1:] (n,)
    cost=(1/m)*(term1-term2)+(1/(2*m))*term3
    return cost
#计算梯度值
def compute_grad(theta,X,y,lmd):
    m=y.size#样本数
    grad=np.zeros(theta.shape)#梯度是与参数同维的向量
    myh=h(X,theta)#得到假设函数值

    reg=(lmd/m)*theta[1:]  #reg(n,)
    grad=(myh-y).dot(X)/m  # grad:(n+1,)

    grad[1:]+=reg
    return grad

def Ir_cost_function(theta,X,y,lmd):
    cost=compute_cost(theta,X,y,lmd)
    grad=compute_grad(theta,X,y,lmd)

    return cost,grad
1.4 对编写函数做简单的测试
theta_t=np.array([-2,-1,1,2])#初始化假设函数的参数  假设有4个参数
X_t=np.c_[np.ones(5),np.arange(1,16).reshape(3,5).T/10]#输入特征矩阵 5个训练样本
y_t=np.array([1,0,1,0,1])#标签 做2分类

lmda_t=3#正规化惩罚性系数
cost,grad=Ir_cost_function(theta_t,X_t,y_t,lmda_t)

np.set_printoptions(formatter={'float':'{:0.6f}'.format})
print('Cost:{:0.7f}'.format(cost))  #2.5348194
print('Gradients:\n{}'.format(grad)) #[0.146561 -0.548558 0.724722 1.398003]
1.5 编写逻辑回归多分类器的训练程序one_vs_all
‘’’
逻辑回归多分类器的训练过程:
用逻辑回归做多分类 相当于做多次2分类, 每一次把其中一个类别当作正类 其余全是负类,手写数字识别是10分类 需要做十次2分类 。
比如:第一次把数字0当作正类, 设置新的标签为1 ; 数字1-9为负类 , 设置新的标签是0 进行2分类。 第二次把数字1当作正类, 设置新的标签为1 ; 数字2-9和0为负类 , 设置新的标签是0 进行2分类。
以此类推...
  import scipy.optimize as opt #高级优化函数的包

#定义一个优化函数 实际上调用的是Python内置的高级优化函数
#可以把它想象成梯度下降法 但是不用手动设置学习率
''' fmin_cg优化函数 第一个参数是计算代价的函数 第二个参数是计算梯度的函数 参数x0传入初始化的theta值
    args传入训练样本的输入特征矩阵X,对应的2分类新标签y,正则化惩罚项系数lmd
    maxiter设置最大迭代优化次数
'''
def optimizeTheta(theta,X,y,lmd):
    res=opt.fmin_cg(compute_cost,fprime=compute_grad,x0=theta,\
                    args=(X,y,lmd),maxiter=50,disp=False,full_output=True)
    return res[0],res[1]


def one_vs_all(X,y,num_labels,lmd):
    (m,n)=X.shape#m为训练样本数  n为原始输入特征数

    all_theta=np.zeros((num_labels,n+1)) #存放十次2分类的 最优化参数
    initial_theta=np.zeros(n+1) #每一次2分类的初始化参数值

    X=np.c_[np.ones(m),X]#添加一列特征值为1

    for i in range(num_labels):
        print('Optimizing for handwritten number {}...'.format(i))
        iclass=i if i else 10#数字0属于第十个类别
        logic_Y=np.array([1 if x==iclass else 0 for x in y])#设置每次2分类的新标签
        itheta,imincost=optimizeTheta(initial_theta,X,logic_Y,lmd)
        all_theta[i,:]=itheta
    print('Done')

    return all_theta #返回十次2分类的 最优化参数


lmd=0.1#正则化惩罚项系数
all_theta=one_vs_all(X,y,num_labels,lmd)#返回训练好的参数
1.6 在训练集上测试分类器的准确率
def predict_one_vs_all(all_theta, X):
    m = X.shape[0]   #shape[0]返回2维数组的行数,即样本数。

    p = np.zeros(m)  #存储分类器预测的类别标签

    X = np.c_[np.ones(m), X]  #增加一列1 X:5000*401

    Y=h(X,all_theta.T)  #all_theta:10*401   Y:5000*10  每一行是每一个样本属于10个类别的概率

    p=np.argmax(Y,axis=1) #找出每一行最大概率所在的位置

    p[p==0]=10  #如果是数字0的话  他属于的类别应该是10

    return p

pred = predict_one_vs_all(all_theta, X) #分类器的预测类别

print('Training set accuracy: {}'.format(np.mean(pred == y)*100))# 95.14
二、利用神经网络进行手写数字识别
在本练习的前一部分中,您实现了多类逻辑回归来识别手写数字。然而,逻辑回归不能形成更复杂的假设。在本练习的这一部分中,您将实现一个神经网络,使用与前面相同的训练集来识别手写数字。神经网络将能够描述形成非线性假设的复杂模型。本周,你将使用我们已经训练过的神经网络的参数,用我们的权值进行预测,实现前馈传播。在下周的练习中,将编写用于学习神经网络参数的反向传播算法。
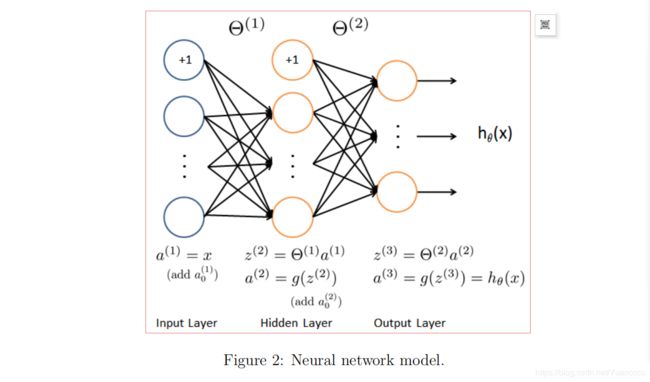
神经网络模型如图2所示:

它有3层-一个输入层,一个隐藏层和一个输出层。回想一下,我们的输入是数字图像的像素值。图像大小为20×20,这给我们400个输入层单元(不包括总输出1的额外偏置单元)。和前面一样,训练数据将被加载到变量X和y中。你个我们已经为AVAS提供了一组网络参数(Θ(1),Θ(2)。这些存储在ex3wts.mat中,并将由EX3n.m加载到theta 1和theta 2中,参数都很模糊。第二层中有25个单元和10个输出单元(对应于10个数字类)的神经网络的大小。
2.1、加载数据集并可视化
import matplotlib.pyplot as plt
import numpy as np
import scipy.io as scio  #读取.mat文件

input_layer_size=400 #输入层的单元数  原始输入特征数 20*20=400
hidden_layer_size=25 #隐藏层 25个神经元
num_labels=10    # 10个标签 数字0对应类别10  数字1-9对应类别1-9

def display_data(x):
    (m, n) = x.shape   #100*400

    example_width = np.round(np.sqrt(n)).astype(int) #每个样本显示宽度 round()四舍五入到个位 并转换为int
    example_height = (n / example_width).astype(int) #每个样本显示高度  并转换为int

    #设置显示格式 100个样本 分10行 10列显示
    display_rows = np.floor(np.sqrt(m)).astype(int)
    display_cols = np.ceil(m / display_rows).astype(int)

    # 待显示的每张图片之间的间隔
    pad = 1

    # 显示的布局矩阵 初始化值为-1
    display_array = - np.ones((pad + display_rows * (example_height + pad),
                              pad + display_rows * (example_height + pad)))

    # Copy each example into a patch on the display array
    curr_ex = 0
    for j in range(display_rows):
        for i in range(display_cols):
            if curr_ex > m:
                break

            # Copy the patch
            # Get the max value of the patch
            max_val = np.max(np.abs(x[curr_ex]))
            display_array[pad + j * (example_height + pad) + np.arange(example_height),
                          pad + i * (example_width + pad) + np.arange(example_width)[:, np.newaxis]] = \
                          x[curr_ex].reshape((example_height, example_width)) / max_val
            curr_ex += 1

        if curr_ex > m:
            break

    # 显示图片
    plt.figure()
    plt.imshow(display_array, cmap='gray', extent=[-1, 1, -1, 1])
    plt.axis('off')


print('Loading and Visualizing Data ...')

data = scio.loadmat('ex3data1.mat') #读取数据
X = data['X']  #获取输入特征矩阵 5000*400
y = data['y'].flatten()  #获取5000个样本的标签 用flatten()函数 将5000*1的2维数组 转换成包含5000个元素的一维数组
m = y.size  #样本数 5000

# 随机选100个样本 可视化
rand_indices = np.random.permutation(range(m))
selected = X[rand_indices[0:100], :]

display_data(selected)
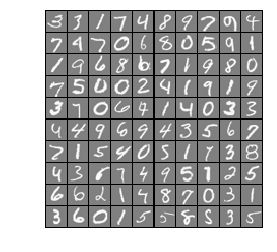
运行结果:

2.2、加载训练好的神经网络参数
因为本周的课程只讲了神经网络的前向传播,下周讲解神经网络的反向传播算法,来训练得到一组最优的参数。所以提供了训练好的参数,该实验只需要完成神经网络前向传播的预测过程,不涉及训练过程。
   data=scio.loadmat('ex3weights.mat')#读取参数数据

    #本实验神经网络结构只有3层 输入层,隐藏层 输出层
    theta1 = data['Theta1'] #输入层和隐藏层之间的参数矩阵
    theta2 = data['Theta2'] #隐藏层和输出层之间的参数矩阵
2.3、实现预测过程
 #利用训练好的参数 完成神经网络的前向传播 实现预测过程
    #sigmoid函数
    def sigmoid(z):
        return 1/(1+np.exp(-z))

def predict(theta1,theta2,x):
    #theta1:25*401 输入层多一个偏置项
    #theta2:10*26  隐藏层多一个偏置项
    m=x.shape[0]#样本数
    num_labels=theta2.shape[0]#类别数

    x=np.c_[np.ones(m),x] #增加一列1   x:5000*401
    p=np.zeros(m)
    z1=x.dot(theta1.T)#z1:5000*25
    a1=sigmoid(z1) #a1:5000*25
    a1=np.c_[np.ones(m),a1]#增加一列1 a1:5000*26
    z2=a1.dot(theta2.T)#z2:5000*10
    a2=sigmoid(z2)#a2:5000*10

    p=np.argmax(a2,axis=1)#输出层的10个单元 第一个对应数字1...第十个对应数字0

    p+=1 #最大位置+1 即为预测的标签

    return p


pred = predict(theta1, theta2, X)

print('Training set accuracy: {}'.format(np.mean(pred == y)*100))#97.52
