【MATLAB】MATLAB 可视化之线图
翻译自 MATLAB 官方文档
- plot:二维线图
- plot3 :三维线图
- loglog : 对数-对数 刻度图
- semilogx: x轴按照对数刻度绘制数据
- semilogy : y轴按照对数刻度绘制数据
- errorbar : 含误差条的线图
- fplot:绘制表达式或函数
- fplot3: 三维参数化曲线绘制函数
- fimplicit: 绘制隐函数
plot:二维线图
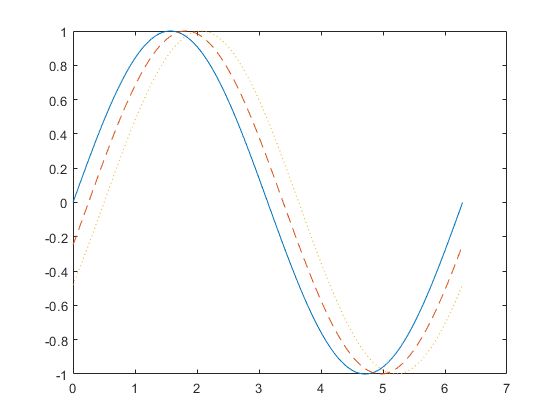
x = 0:pi/100:2*pi;
y1 = sin(x);
y2 = sin(x-0.25);
y3 = sin(x-0.5);

figure
plot(x,y1,x,y2,'--',x,y3,':')
plot3 :三维线图
t = 0:pi/50:10*pi;
st = sin(t);
ct = cos(t);

figure
plot3(st,ct,t)
loglog : 对数-对数 刻度图
x = logspace(-1,2);
y = exp(x);
loglog(x,y,'-s')
grid on
semilogx: x轴按照对数刻度绘制数据
x = 0:1000;
y = log(x);

figure
semilogx(x,y)
semilogy : y轴按照对数刻度绘制数据
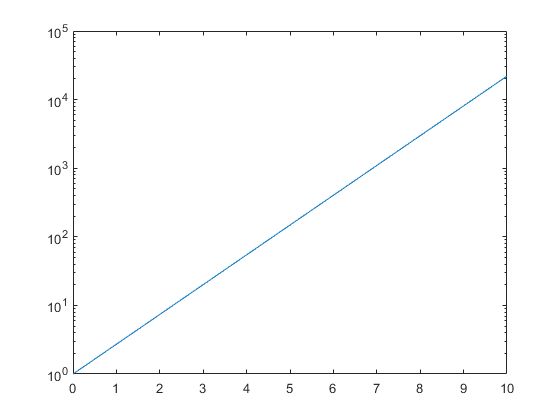
x = 0:0.1:10;
y = exp(x);

figure
semilogy(x,y)
errorbar : 含误差条的线图
x = 1:10:100;
y = [20 30 45 40 60 65 80 75 95 90];
err = [5 8 2 9 3 3 8 3 9 3];
errorbar(x,y,err)
fplot:绘制表达式或函数
对于函数
ex,−3<x≤0cos(x),0<x<3 e x , − 3 < x ≤ 0 cos ( x ) , 0 < x < 3
fplot(@(x) exp(x),[-3 0],'b')
hold on
fplot(@(x) cos(x),[0 3],'b')
hold off
grid on
fplot3: 三维参数化曲线绘制函数
xt = @(t) exp(-t/10).*sin(5*t);
yt = @(t) exp(-t/10).*cos(5*t);
zt = @(t) t;
fplot3(xt,yt,zt,[-10 10])
fimplicit: 绘制隐函数
在 x∈[−3,0],y∈[−2,2] x ∈ [ − 3 , 0 ] , y ∈ [ − 2 , 2 ] 区间内绘制函数 x2+y2−3=0 x 2 + y 2 − 3 = 0
f = @(x,y) x.^2 + y.^2 - 3;
fimplicit(f,[-3 0 -2 2])


