android 深度图
在 Android开发中自定义控件是一个范围很广的话题,讲起自定义控件,从广度上来划分的话,大体上可以划分为:
- View、ViewGroup的绘制
- 事件分发
- 各种动画效果
- 滚动嵌套机制
- 还有涉及到相关的数学知识等等
本次来讲讲如何实现交易所中的K线图,首先通过一张深度图开始讲解下相关业务需求
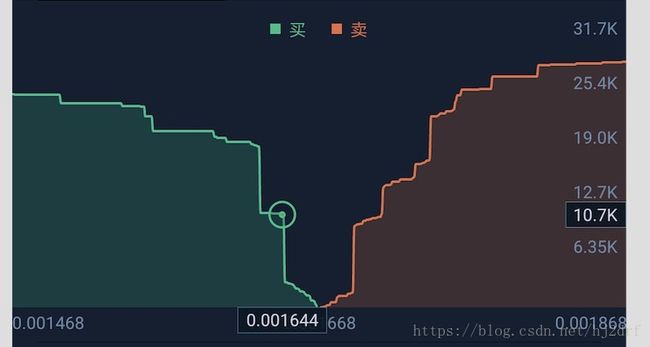
深度图一般代表交易所当前买入和卖出的委托量(不是指成交),从这张图我们可以看出X轴代表价格,价格从左往右依次增高,Y轴代表销量,由下往上递增,要绘制出正常的深度图,每次获取的数据至少包含价格和销量,通常的时间,开盘,收盘,高,低价都可忽略。实际开发中这块获取数据使用长链接即可,后台每次返回规定的买入和卖出的数据数量,要先处理后台的返回数据:
- 首先将返回的买入和卖出的数据分开按照价格从低到高排序
- 然后再去处理每个价格对应的委托量,因为返回的当前价格对应的委托量是无法对应深度图的坐标轴,我们需要将按价格排序后,高的价格去加上上一个价格的委托量,这样才可保证委托量的展示是在递增
处理完返回的数据后重新填充数据即可。处理完数据后就要开始处理交互方面了,当用户点击或者长按的时候就要展示当前选中点的相关数据了,从图中可以看到选中的时候有个圆圈以及在X,Y轴上展示了此坐标的价格和委托量。
先上效果图:
由于上传大小的限制,修改了gif的质量,所以效果不是很好。
通过上面的实现效果可以看到做了一点功能上的简化,长按之后我并没有将结果展示在X,Y轴上而是直接显示在中间,不过这些都是次要的,最重要的是理解思路,看了源码后可以根据自己的需求修改。
首先讲下从后台获取到数据的处理,先将数据按价格进行排序,然后通过遍历下集合,将每个bean对象的委托量的数值累加下上一个的然后重新赋值,同时获取买入和卖出的最高和最低价格,后面会用到数据展示
    public void setData(List buyData, List sellData) {
        float vol = 0;
        if (buyData.size() > 0) {
            mBuyData.clear();
            //买入数据按价格进行排序
            Collections.sort(buyData, new comparePrice());
            DepthDataBean depthDataBean;
            //累加买入委托量
            for (int index = buyData.size() - 1; index >= 0; index--) {
                depthDataBean = buyData.get(index);
                vol += depthDataBean.getVolume();
                depthDataBean.setVolume(vol);
                mBuyData.add(0, depthDataBean);
            }
            //修改底部买入价格展示
            mBottomPrice[0] = mBuyData.get(0).getPrice();
            mBottomPrice[1] = mBuyData.get(mBuyData.size() > 1 ? mBuyData.size() - 1 : 0).getPrice();
            mMaxVolume = mBuyData.get(0).getVolume();
        }

        if (sellData.size() > 0) {
            mSellData.clear();
            vol = 0;
            //卖出数据按价格进行排序
            Collections.sort(sellData, new comparePrice());
            //累加卖出委托量
            for (DepthDataBean depthDataBean : sellData) {
                vol += depthDataBean.getVolume();
                depthDataBean.setVolume(vol);
                mSellData.add(depthDataBean);
            }
            //修改底部卖出价格展示
            mBottomPrice[2] = mSellData.get(0).getPrice();
            mBottomPrice[3] = mSellData.get(mSellData.size() > 1 ? mSellData.size() - 1 : 0).getPrice();
            mMaxVolume = Math.max(mMaxVolume, mSellData.get(mSellData.size() - 1).getVolume());
        }
        mMaxVolume = mMaxVolume * 1.05f;
        mMultiple = mMaxVolume / mLineCount;
        invalidate();
    }
数据处理好后就要开始绘制了
    @Override
    protected void onDraw(Canvas canvas) {
        super.onDraw(canvas);
        canvas.drawColor(mBackgroundColor);
        canvas.save();
        //绘制买入区域
        drawBuy(canvas);
        //绘制卖出区域
        drawSell(canvas);
        //绘制界面相关文案
        drawText(canvas);
        canvas.restore();
    }

    private void drawBuy(Canvas canvas) {
        mGridWidth = (mDrawWidth * 1.0f / (mBuyData.size() - 1 == 0 ? 1 : mBuyData.size() - 1));
        mBuyPath.reset();
        mMapX.clear();
        mMapY.clear();
        float x;
        float y;
        for (int i = 0; i < mBuyData.size(); i++) {
            if (i == 0) {
                mBuyPath.moveTo(0, getY(mBuyData.get(0).getVolume()));
            }
            y = getY(mBuyData.get(i).getVolume());
            if (i >= 1) {
                canvas.drawLine(mGridWidth * (i - 1), getY(mBuyData.get(i - 1).getVolume()), mGridWidth * i, y, mBuyLinePaint);
            }
            if (i != mBuyData.size() - 1) {
                mBuyPath.quadTo(mGridWidth * i, y, mGridWidth * (i + 1), getY(mBuyData.get(i + 1).getVolume()));
            }

            x = mGridWidth * i;
            mMapX.put((int) x, mBuyData.get(i));
            mMapY.put((int) x, y);
            if (i == mBuyData.size() - 1) {
                mBuyPath.quadTo(mGridWidth * i, y, mGridWidth * i, mDrawHeight);
                mBuyPath.quadTo(mGridWidth * i, mDrawHeight, 0, mDrawHeight);
                mBuyPath.close();
            }
        }
        canvas.drawPath(mBuyPath, mBuyPathPaint);
	}

    private void drawSell(Canvas canvas) {
        mGridWidth = (mDrawWidth * 1.0f / (mSellData.size() - 1 == 0 ? 1 : mSellData.size() - 1));
        mSellPath.reset();
        float x;
        float y;
        for (int i = 0; i < mSellData.size(); i++) {
            if (i == 0) {
                mSellPath.moveTo(mDrawWidth, getY(mSellData.get(0).getVolume()));
            }
            y = getY(mSellData.get(i).getVolume());
            if (i >= 1) {
                canvas.drawLine((mGridWidth * (i - 1)) + mDrawWidth, getY(mSellData.get(i - 1).getVolume()),
                        (mGridWidth * i) + mDrawWidth, y, mSellLinePaint);
            }
            if (i != mSellData.size() - 1) {
                mSellPath.quadTo((mGridWidth * i) + mDrawWidth, y,
                        (mGridWidth * (i + 1)) + mDrawWidth, getY(mSellData.get(i + 1).getVolume()));
            }
            x = (mGridWidth * i) + mDrawWidth;
            mMapX.put((int) x, mSellData.get(i));
            mMapY.put((int) x, y);
            if (i == mSellData.size() - 1) {
                mSellPath.quadTo(mWidth, y, (mGridWidth * i) + mDrawWidth, mDrawHeight);
                mSellPath.quadTo((mGridWidth * i) + mDrawWidth, mDrawHeight, mDrawWidth, mDrawHeight);
                mSellPath.close();
            }
        }
        canvas.drawPath(mSellPath, mSellPathPaint);
    }
上面的是主要的绘制代码块,代码逻辑就是先绘制出区域的边线,同时通过path类记录下相关的位置,遍历到最后一个对象时直接将path的路径首位相连,再去绘制path所记录的区域
绘制文案的代码需要注意下
    private void drawText(Canvas canvas) {
        float value;
        String str;
        for (int j = 0; j < mLineCount; j++) {
            value = mMaxVolume - mMultiple * j;
            str = getVolumeValue(value);
            canvas.drawText(str, mWidth, mDrawHeight / mLineCount * j + 30, mTextPaint);
        }
        int size = mBottomPrice.length;
        int height = mDrawHeight + mBottomPriceHeight / 2 + 10;
        if (size > 0 && mBottomPrice[0] != null) {
            String data = getValue(mBottomPrice[0]);
            canvas.drawText(data, mTextPaint.measureText(data), height, mTextPaint);
            data = getValue(mBottomPrice[1]);
            canvas.drawText(data, mDrawWidth - 10, height, mTextPaint);
            data = getValue(mBottomPrice[2]);
            canvas.drawText(data, mDrawWidth + mTextPaint.measureText(data) + 10, height, mTextPaint);
            data = getValue(mBottomPrice[3]);
            canvas.drawText(data, mWidth, height, mTextPaint);
        }
        if (mIsLongPress) {
            mIsHave = false;
            for (int key : mMapX.keySet()) {
                if (key == mEventX) {
                    mLastPosition = mEventX;
                    drawSelectorView(canvas, key);
                    break;
                }
            }
            //这里这么处理是保证滑动的时候界面始终有选中的感觉,不至于未选中的时候没有展示,界面有闪烁感,体验不好
            if (!mIsHave) {
                drawSelectorView(canvas, mLastPosition);
            }
        }
    }
以上是此自定义控件的主要代码,项目已上传至github,欢迎各位老铁们star,fork,此库定期更新一些自定义控件,相互交流学习。