【机器学习】模型的性能评价指标
混淆矩阵
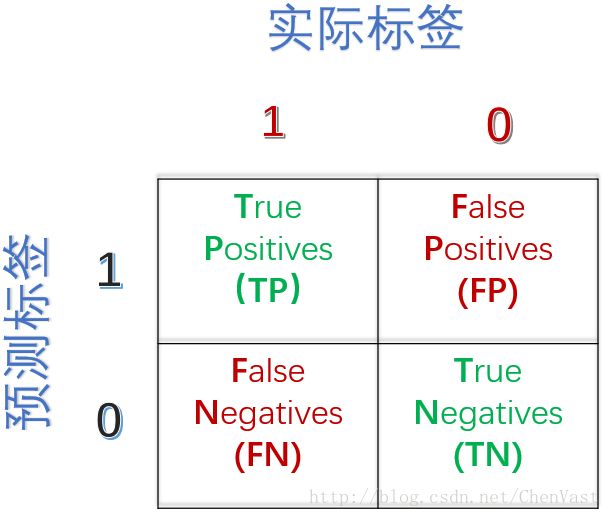
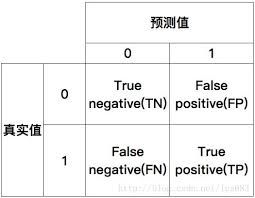
混淆矩阵:展示学习算法性能的一种矩阵,一个简单的方阵,展示一个分类器预测结果(真正,真负,假正,假负)的数量
图:


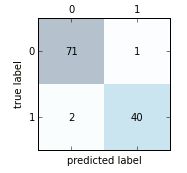
使用SKlearn的confusion_matrix方法实现混淆矩阵:
from sklearn.metrics import confusion_matrix
pipe_svc.fit(X_train, y_train)
y_pred = pipe_svc.predict(X_test)
confmat = confusion_matrix(y_true=y_test, y_pred=y_pred)
print(confmat)
# 绘制混淆矩阵
fig, ax = plt.subplots(figsize=(2.5, 2.5))
ax.matshow(confmat, cmap=plt.cm.Blues, alpha=0.3)
for i in range(confmat.shape[0]):
    for j in range(confmat.shape[1]):
        ax.text(x=j, y=i, s=confmat[i, j], va='center', ha='center')

plt.xlabel('predicted label')
plt.ylabel('true label')

plt.tight_layout()
# plt.savefig('./figures/confusion_matrix.png', dpi=300)
plt.show()

准确率和召回率
预测误差和准确率投提供了误分类样本数量的相关信息。
误差(ERR):预测错样本的数量与所有被预测样本数量的比值
准确率(ACC):正确预测样本的数量与所有被预测样本数量的比值
对于类别数量不均衡的分类问题来说,真正率与假正率是非常有用的性能指标。
使用SKlearn实现这两种评分指标:
from sklearn.metrics import precision_score, recall_score, f1_score

print('Precision: %.3f' % precision_score(y_true=y_test, y_pred=y_pred))
print('Recall: %.3f' % recall_score(y_true=y_test, y_pred=y_pred))
print('F1: %.3f' % f1_score(y_true=y_test, y_pred=y_pred))

通过make_scorer函数构建评分,则可以以参数的形式提供给GridSearchCV:
from sklearn.metrics import make_scorer, f1_score

scorer = make_scorer(f1_score, pos_label=0)

c_gamma_range = [0.01, 0.1, 1.0, 10.0]

param_grid = [{'clf__C': c_gamma_range,
               'clf__kernel': ['linear']},
                 {'clf__C': c_gamma_range,
                  'clf__gamma': c_gamma_range,
                  'clf__kernel': ['rbf'],}]

gs = GridSearchCV(estimator=pipe_svc,
                                param_grid=param_grid,
                                scoring=scorer,
                                cv=10,
                                n_jobs=-1)
gs = gs.fit(X_train, y_train)
print(gs.best_score_)
print(gs.best_params_)
ROC曲线:
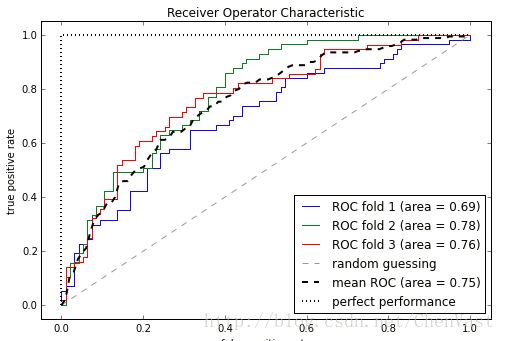
受试者工作特征曲线(ROC):基于模型的假正率和真正率等性能指标进行分类模型选择的有用工具。
假正率和真正率通过移动分类器的分类筏值来计算。
ROC的对角线可以理解为随机猜测。
如果分类器性能曲线在对角线以下,那么性能就比随机猜测还差。
基于ROC可以计算ROC线下区域(AUC)来刻画分类模型的性能。
使用乳腺癌数据集中的两个特征判断肿瘤是良性还是恶性,并绘制ROC曲线,再次使用逻辑回归流水线。
from sklearn.metrics import roc_curve, auc
from scipy import interp

X_train2 = X_train[:, [4, 14]]

cv = StratifiedKFold(y_train, n_folds=3, random_state=1)

fig = plt.figure(figsize=(7, 5))

mean_tpr = 0.0
mean_fpr = np.linspace(0, 1, 100)
all_tpr = []

for i, (train, test) in enumerate(cv):
    probas = pipe_lr.fit(X_train2[train],
                         y_train[train]).predict_proba(X_train2[test])

    fpr, tpr, thresholds = roc_curve(y_train[test],
                                     probas[:, 1],
                                     pos_label=1)
    mean_tpr += interp(mean_fpr, fpr, tpr)
    mean_tpr[0] = 0.0
    roc_auc = auc(fpr, tpr)
    plt.plot(fpr,
             tpr,
             lw=1,
             label='ROC fold %d (area = %0.2f)'
                    % (i+1, roc_auc))

plt.plot([0, 1],
         [0, 1],
         linestyle='--',
         color=(0.6, 0.6, 0.6),
         label='random guessing')

mean_tpr /= len(cv)
mean_tpr[-1] = 1.0
mean_auc = auc(mean_fpr, mean_tpr)
plt.plot(mean_fpr, mean_tpr, 'k--',
         label='mean ROC (area = %0.2f)' % mean_auc, lw=2)
plt.plot([0, 0, 1],
         [0, 1, 1],
         lw=2,
         linestyle=':',
         color='black',
         label='perfect performance')

plt.xlim([-0.05, 1.05])
plt.ylim([-0.05, 1.05])
plt.xlabel('false positive rate')
plt.ylabel('true positive rate')
plt.title('Receiver Operator Characteristic')
plt.legend(loc="lower right")

plt.tight_layout()
# plt.savefig('./figures/roc.png', dpi=300)
plt.show()

通过使用scipy中的interp函数利用三个块数据对 ROC曲线的内插均值进行计算,使用auc函数计算低于ROC曲线区域的面积。
# 计算分类器在单独测试集上的ROC AUC得分
pipe_svc = pipe_svc.fit(X_train2, y_train)
y_pred2 = pipe_svc.predict(X_test[:, [4, 14]])
from sklearn.metrics import roc_auc_score, accuracy_score
print('ROC AUC: %.3f' % roc_auc_score(y_true=y_test, y_score=y_pred2))
print('Accuracy: %.3f' % accuracy_score(y_true=y_test, y_pred=y_pred2))
多类别分类器的评价标准
Scikit-learn实现了macro(宏)均值和micro(微)均值方法。
微均值:等同看待每个实例或每次预测时,通过系统的真正,真负,假正,假负来计算
宏均值:等同看待各个类别,将其用于评估分类器针对最频繁类标的整体性能。
通过sklearn.metrics模块导入其他不同的平方参数,利用内置的average参数定义平均方法
使用方法:pre_scorer = make_scorer(score_func=precision_score,
pos_label=1,
greater_is_better=True,
average='micro')