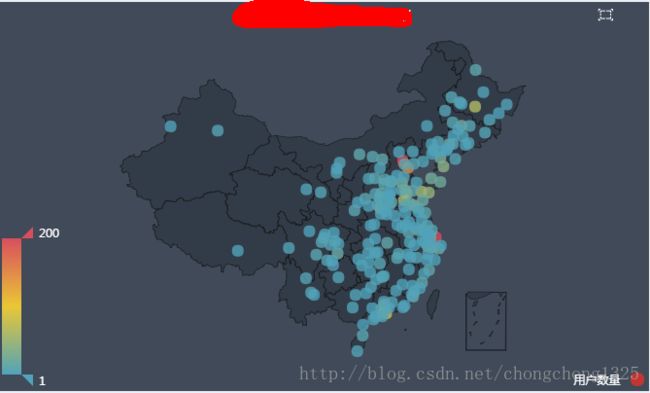
angular2 插件ngx-echarts引入及其应用
1.安装ngx-echarts
npm install echarts –save
npm install ngx-echarts –save
2.引入echarts
首先要引入echarts相关js
A: 使用angular-cli创建项目,打开angular-cli.json,作如下配置
{   "scripts": [
    "../node_modules/echarts/dist/echarts.min.js" ,
    "../node_modules/echarts/map/js/china.js",//地图
    "../node_modules/echarts/dist/extension/bmap.js"   ], }
如果只是引用普通的图表,不引入地图的话,上面的配置中后面两行可以去掉。
具体应用
- 在module里面配置ngx-echarts
import { AngularEchartsModule } from 'ngx-echarts';
...
@NgModule({
  imports: [
    AngularEchartsModule
  ],
  ...
})
2.html页面中
<div echarts id="map" [(options)]="option" class="map" (chartClick)="onChartClick($event)" (chartInit)="onMapInit($event)">div>- 在组件中
import { Component, OnInit } from "@angular/core";
@Component({
  selector: "echarts",
  templateUrl: "./echarts.component.html"
})
export class EchartsComponent implements OnInit {
    mapIntance:any;
    onMapInit(ev){//地图初始化
        var thisFunc =this;
        this.mapIntance = ev;
     }
     //this.cityList 与this.geoCoordMapData是从后台接口获取的数据
    //接口如下:
    getCityRegion(){
        this.option = this.getMapOption([],{})//初始化地图
        this.option = this.getMapOption(this.cityList,this.geoCoordMapData);
        this.mapIntance.setOption(this.option);//更新地图数据
    }

    ngOnInit(){
    this.getCityRegion()
    }
    getMapOption(mapdata,geoCoordMapData)
    {
        var mapData = mapdata;
         var geoCoordMap = geoCoordMapData;
         // debugger
         var convertData = function (data) {
             var res = [];
             for (var i = 0; i < data.length; i++) {
                 var geoCoord = geoCoordMap[data[i].name];
                 if (geoCoord) {
                     res.push({
                         name: data[i].name,
                         value: geoCoord.concat(data[i].value),
                         id:geoCoord.concat(data[i].cityId)
                     });
                 }
             }
             return res;
         };
         return {
             backgroundColor: '#404a59',
             title: {
                 text: '全国主要城市用户分布',
                 // subtext: 'data from PM25.in',
                 // sublink: 'http://www.pm25.in',
                 x:'center',
                 textStyle: {
                     color: '#fff'
                 }
             },
             tooltip: {
                 trigger: 'item',
                 formatter: function (params) {
                     return params.name+','+params.value[2];
                 }
             },
             legend: {
                 orient: 'vertical',
                 y: 'bottom',
                 x:'right',
                 data:['用户数量'],
                 textStyle: {
                     color: '#fff'
                 }
             },
             toolbox: {
                 iconStyle: {
                     normal: {
                         borderColor: '#fff',
                     },
                     emphasis: {
                         borderColor: '#b1e4ff'
                     }
                 },
                 feature:{
                     brush:{
                         type:['rect']
                     }
                 },
                 right:30,
                 // width:50,
                 // height:48
             },
             brush: {
                 outOfBrush: {
                     color: '#abc'
                 },
                 brushStyle: {
                     borderWidth: 2,
                     color: 'rgba(0,0,0,0.2)',
                     borderColor: 'rgba(0,0,0,0.5)',
                 },
                 seriesIndex: [0, 1],
                 throttleType: 'debounce',
                 throttleDelay: 300,
                 geoIndex:0 //规定坐标

             },
             visualMap: {
                 min: 1,
                 max: 200,
                 calculable: true,
                 inRange: {
                     color: ['#50a3ba', '#eac736', '#d94e5d']
                 },
                 textStyle: {
                     color: '#fff'
                 }
             },
             geo: {
                 map: 'china',
                 label: {
                     emphasis: {
                         show: false
                     }
                 },
                 roam: true,
                 itemStyle: {
                     normal: {
                         areaColor: '#323c48',
                         borderColor: '#111'
                     },
                     emphasis: {
                         areaColor: '#2a333d'
                     }
                 }
             },
             series: [
             {
                 name: '用户数量',
                 type: 'scatter',
                 coordinateSystem: 'geo',
                 data: convertData(mapData),
                 symbolSize: 12,
                 label: {
                     normal: {
                         show: false
                     },
                     emphasis: {
                         show: false
                     }
                 },
                 itemStyle: {
                     emphasis: {
                         borderColor: '#fff',
                         borderWidth: 1
                     }
                 }
             }
             ]
         }
        }

}