NLP成长计划(一)
Getting Set Up
需要安装的程序:
- Anaconda 5.0.1 Python 3.6
https://www.anaconda.com/download/
-- Python 3.6 可以更好地处理文本数据
-- Anacond 收集了流行的libraries以及packages.
- XGboost
安装XGBoost:
conda install -c conda-forge xgboost
本文包含
- Logistic classifier
- precision, recal, F1
- XGBoost classifer
1) Logistic Regression
二元分类法
在二元分类问题中,我们试图预测一个二进制结果,并将0和1的标签分配给我们的数据。
比如:
- 病人有癌症吗?
- 球队会赢得下一场比赛吗?
- 顾客会购买我的产品吗?
- 我会得到贷款吗?
- 这篇文章是假的吗?
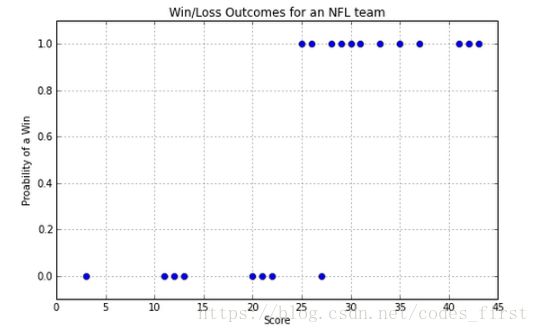
让我们从一个例子开始。我们将使用一些NFL数据。x轴是球队在一个赛季中触地得分的数目,y轴是他们输了还是赢了比赛,分别用0或1表示。
那么,如果我们得到一个分数,我们如何预测我们是赢还是输?请注意,我们将预测0到1之间的值。接近0意味着我们确信它在0班,接近1,这意味着我们确信它在1班,接近0.5意味着我们不知道。
如果我们对上面的NFL示例使用线性回归,我们肯定会比随机猜测做得更好,但是它不能准确地表示数据:
因此,一条线不是最好的建模数据的方法。所以我们需要找到更好的曲线。
The Logistic Function
首先,我们将从数据科学袋中拉出一个函数,并显示它工作得相当好。
第二,我们将理解我们是如何产生这个函数以及它是如何与二进制结果和几率相关的。但在此之前,让我们更好地理解这一点。
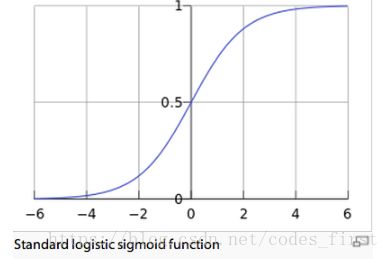
这个函数需要有0的损失分数和1的胜利分数。有意义的是,分数需要0,分数低于1,其他分数和以上分数都是。在中等范围内需要平稳地从0增加到1。
它需要看起来像这样:
具有上述形状的函数为:
这是逻辑函数,也称为乙状函数。注意,当t接近无穷大时,逻辑函数的值接近1,当t接近负无穷大时,逻辑函数的值接近0。我们用这个式子: t=β0+β1xt=β0+β1x, 这意味着我们将处理一个熟悉的线性函数。
这给了我们:
P(x)是我们的假设,它代表了一个得分x导致获胜的概率。
β0β0和β1β1是最适合我们数据的参数。
# inital imports

# pandats is like a more powerful version of excel, we're using it to read a .csv file and manipulate tables
import pandas as pd
# a very popular graph plotting library
import matplotlib.pyplot as plt
# makes matplotlib look a bit better
import seaborn
# this makes the plots display in the notebook (here) rather than open as a file
%matplotlib inline
# Load the dataset into pandas: data/grad.csv
df = pd.read_csv('data/grad.csv')
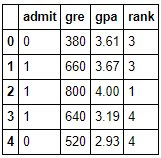
# view the first 5 rows
df.head()
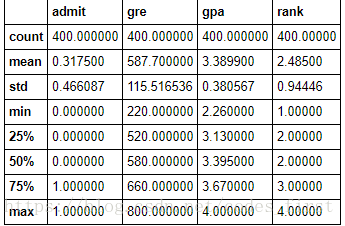
# Use the pandas describe method to get some preliminary summary statistics on the data.
# In particular look at the mean values of the features.
df.describe()

# look at the distribution of values
pd.DataFrame.hist(df, bins=15);
# data transformation
import numpy as np
X = np.asarray(df[['gre','gpa','rank']])
y = np.asarray(df['admit'])
# data preprocessing - normalization
X_norm = (X - X.mean(axis=0)) / (X.max(axis=0) - X.min(axis=0)) # normed by col
X_norm = np.insert(X_norm, 0, 1, axis=1) # col of 1s
y = np.asarray(df['admit']) # true values
#X = np.insert(X, 0, 1, axis=1) # 11111111111111!
print(X_norm)from sklearn.model_selection import train_test_split
# split data into train and test sets
seed = 42
test_size = 0.33
X_train, X_test, y_train, y_test = train_test_split(X, y, test_size=test_size, random_state=seed)
# instantiate a logistic regression model, and fit with X and y
from sklearn.linear_model import LogisticRegression
print(X_train)
print(y_train)
model = LogisticRegression()
model = model.fit(X_train, y_train)
y_pred = model.predict(X_test)
# check the accuracy on the training set
model.score(X_test, y_test)Accuracy:
最简单的方法是精度。这是对预测总数的正确预测数。这是你正确预测的百分比。在SKEXLY中,这是得分法计算的。
Shortcomings of Accuracy:
准确性往往是一个很好的一目了然的措施,但它有许多缺点。如果类是不平衡的,准确度不会衡量你在预测中的表现。假设你正在尝试预测电子邮件是否是垃圾邮件。只有2%的电子邮件实际上是垃圾邮件。你可以通过预测垃圾邮件而获得98%的准确率。这是一个伟大的准确性,但一个可怕的模型!
Confusion Matrix:
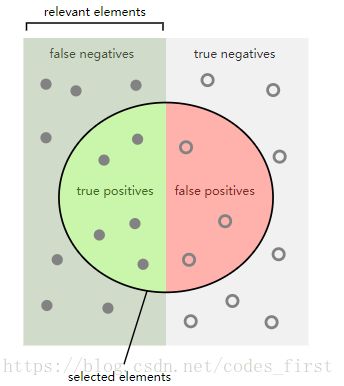
我们可以得到更好的图片我们的模型,但看看混乱矩阵。我们得到以下四个指标:
True Positives (TP):正确的阳性预测
False Positives (FP):不正确的阳性预测(假警报)
True Negatives (TN)::正确的否定预测
False Negatives (FN):错误的负面预测(错过)
通过Logistic回归,我们可以将其可视化如下:
2) Metrics
71.5%的准确度只说明了一部分
Precision, Recall and F1
除了准确性外,我们还可以计算出其他分数:
Precision:衡量你积极预测的好方法
precision= tp/(tp+FP)= TP/(precision yes)
Recall:衡量你预测阳性病例的敏感度。
recall= tp/(tp+fn)= tp/(actual yes)
F1 Score:精度和召回的调和平均值
F1=2 /(1 /precision+ 1 /recall)= 2 *precision*recall/(precision+recall)= 2TP/(2TP+FN+FP)
Accuracy也可以表示为:
Accuracy=(tp+tn)/(tp+fp+tn+fn)
3) A More Advanced Classifier
Random Forests
可能最常见的集成方法是随机森林,它包括决策树的集合。
它们是由Leo Breimen开发的,他在网页上有很多的注释(http://www.stat.berkeley.edu/~breiman/RandomForests/cc_home.htm).
其思想是重复地从数据集中随机选择数据(带有替换),并用每个新示例构建决策树。默认值是随机选择的数据与初始数据集的大小相同。请注意,由于我们用替换来采样,所以许多数据点将在样本中重复,许多数据点将不被包括在内。
随机森林也限制了决策树的每个节点只考虑在特征的随机子集上进行分裂。
这里是创建随机森林的伪代码:
为了对新文档进行分类,使用每棵树来进行预测。选择获得最多选票的标签。
sklearning使用的默认参数(也是标准默认值)是10棵树,并且只考虑sqrt(m)特性(其中m是特性的总数)。
Out of Bag Error
我们可以使用标准的交叉验证方法来分析随机森林,该方法将数据集分成训练集和测试集。然而,如果我们很聪明,我们会注意到每个树都没有看到所有的训练数据,所以我们可以使用跳过的数据分别交叉验证每个树。
我们将跳过数学证明,但是当从数据集中选择时,大约三分之一的数据被省略(如果您想考虑数学(http://math.stackexchange.com/questions/203491/expected-coverage-after-sampling-with-replacement-k-times) )。因此,每个数据点可以用大约1/3的树木进行测试。我们计算这些百分比,我们得到正确的,这是袋外错误。
已经证明这已经足够,并且交叉验证对于随机森林不是严格必要的,但是我们仍然经常使用它,因为这使得与其他模型比较更容易。
Feature Importance
我们可以使用随机森林来确定哪些特征在预测类中最重要。
布赖曼,随机森林的起源,使用袋外错误,以确定特征的重要性,在这里讨论(http://www.stat.berkeley.edu/~breiman/RandomForests/cc_home.htm#varimp)。这个想法是比较树的袋外误差和树的袋外误差,如果你改变特征的值。这里是用于计算单个特征的特征重要性的伪代码:
sklearn使用了一种不同的方法,在这里描述(http://scikit-learn.org/stable/modules/ensemble.html#feature-importance-evaluation)。他们的方法不涉及使用袋外得分。基本上,树的特征越高,确定数据点的结果就越重要。到达节点的数据点的期望分数被用作该特征对于该树的重要性的估计。然后平均所有树上的这些值以获得特征的重要性。
Boosting in General
你经常会听到“打包Bagging"这个词和“推进Boosting”这个词同时出现。这两种技术是非常不同的,并没有真正用在相同的上下文中。你已经知道装袋是什么了。
适当地推进,使用一个模型的输出作为另一个模型的输入。因此,我们可以使用管道来构建在技术上“boosted”的整个模型组。根据理论,任何和所有的模型都可以被提升。
“boo.”这个词最常用于描述与树一起使用的boo.,尤其是梯度增强回归树(GBRT)。你可以把它看作是“结合弱学习者”来形成一个“强大的学习者”。“弱”学习者只是正常的决策树(而不是以某种方式特别弱的估计者)。
Boosting in Trees
现在常用的树木有两种助推方式。这是数据科学中最常用的行话用法。如果你听到科学家们说的"boosting",他们通常指的是被提升的树。
一种boosting方法称为AdaBoost,它看起来像:
另一个是booting:
from xgboost import XGBClassifier

XGmodel = XGBClassifier(max_depth=7,
                        learning_rate=0.2,
                        n_estimators=1000,
                        silent=True,
                        objective='binary:logistic',
                        nthread=-1,
                        gamma=0,
                        min_child_weight=1,
                        max_delta_step=0,
                        subsample=1,
                        colsample_bytree=1,
                        colsample_bylevel=1,
                        reg_alpha=0,
                        reg_lambda=1,
                        scale_pos_weight=1,
                        base_score=0.5,
                        seed=0,
                        missing=None)

XGmodel.fit(X_train, y_train)


y_pred = XGmodel.predict(X_test)

target_names = ['Not Admitted', 'Admitted']

print(classification_report(y_test, y_pred, target_names=target_names))
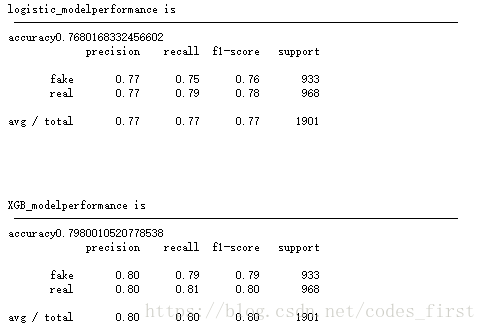
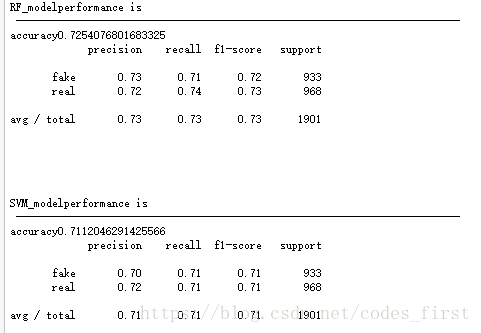
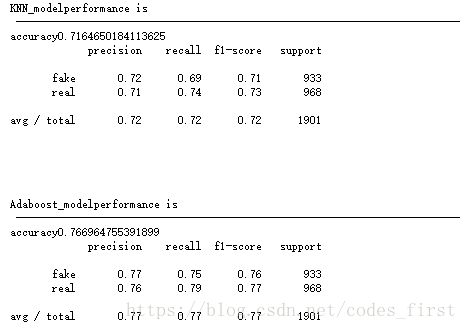
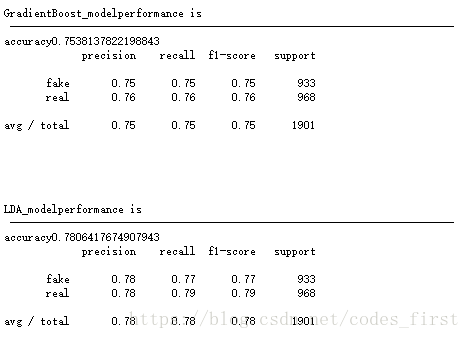
附上sklearn相关多种classification代码及比较:
import pandas as pd
import numpy as np
from ast import literal_eval

from sklearn.model_selection import train_test_split
from sklearn.linear_model import LogisticRegression
from sklearn.metrics import classification_report
from sklearn.ensemble import RandomForestClassifier
from xgboost import XGBClassifier
from sklearn import svm
from sklearn.discriminant_analysis import LinearDiscriminantAnalysis
from sklearn.ensemble import GradientBoostingClassifier
from sklearn.ensemble import AdaBoostClassifier
from sklearn.neighbors import KNeighborsClassifier

def test_model_effect(clf,X_test,y_test,name_str):
    print(name_str + "performance is \t\t\n --------------------------------------------------------------------------")
    # check the accuracy
    print("accuracy"+str(clf.score(X_test, y_test)))

    # check Precision, Recall and F1
    y_pred = clf.predict(X_test)
    target_names = ['fake', 'real']
    print(classification_report(y_test, y_pred, target_names=target_names))

    print("\n\n\n")

def logistic_model(X_train, y_train,X_test,y_test):
    model = LogisticRegression()
    model = model.fit(X_train, y_train)

    name_str="logistic_model"
    test_model_effect(model,X_test,y_test,name_str)


def XGB_model(X_train, y_train,X_test,y_test):
    XGmodel = XGBClassifier(max_depth=7,
                        learning_rate=0.2,
                        n_estimators=1000,
                        silent=True,
                        objective='binary:logistic',
                        nthread=-1,
                        gamma=0,
                        min_child_weight=1,
                        max_delta_step=0,
                        subsample=1,
                        colsample_bytree=1,
                        colsample_bylevel=1,
                        reg_alpha=0,
                        reg_lambda=1,
                        scale_pos_weight=1,
                        base_score=0.5,
                        seed=0,
                        missing=None)

    XGmodel.fit(X_train, y_train)

    name_str="XGB_model"
    test_model_effect(XGmodel,X_test,y_test,name_str)

def RF_model(X_train, y_train,X_test,y_test):
    clf = RandomForestClassifier(bootstrap=True,
                           class_weight=None,
                           criterion='gini',
                           max_depth=2,
                           max_features='auto',
                           max_leaf_nodes=None,
                           min_impurity_decrease=0.0,
                           min_impurity_split=None,
                           min_samples_leaf=1,
                           min_samples_split=2,
                           min_weight_fraction_leaf=0.0,
                           n_estimators=10,
                           n_jobs=1,
                           oob_score=False,
                           random_state=0,
                           verbose=0,
                           warm_start=False)
    clf.fit(X_train, y_train)

    name_str="RF_model"
    test_model_effect(clf,X_test,y_test,name_str)

def SVM_model(X_train, y_train,X_test,y_test):
    clf = svm.SVC()
    clf.fit(X_train, y_train)  # training the svc model

    name_str="SVM_model"
    test_model_effect(clf,X_test,y_test,name_str)

def KNN_model(X_train, y_train,X_test,y_test):
    neigh = KNeighborsClassifier(n_neighbors=3)
    neigh.fit(X_train, y_train)

    name_str="KNN_model"
    test_model_effect(neigh,X_test,y_test,name_str)

def AdaBoost_model(X_train, y_train,X_test,y_test):
    clf = AdaBoostClassifier(n_estimators=100) #迭代100次
    clf.fit(X_train, y_train)  # training the svc model

    name_str="Adaboost_model"
    test_model_effect(clf,X_test,y_test,name_str)

def GradientBoost_model(X_train, y_train,X_test,y_test):
    clf = GradientBoostingClassifier(n_estimators=100,
                                 learning_rate=1.0,
                                 max_depth=1,
                                 random_state=0)
    clf.fit(X_train, y_train)

    name_str="GradientBoost_model"
    test_model_effect(clf,X_test,y_test,name_str)

def LDA_model(X_train, y_train,X_test,y_test):
    clf = LinearDiscriminantAnalysis()
    clf.fit(X_train, y_train)

    name_str="LDA_model"
    test_model_effect(clf,X_test,y_test,name_str)

if __name__ == "__main__":

    #Reading data and preprocessing
    df = pd.read_csv('data/fake_or_real_news.csv', index_col=0, header=0)
    df.drop('text', axis=1, inplace=True)
    df.rename(columns={"label":"fake"}, inplace=True)
    label_map = {"FAKE": 1, "REAL": 0}
    df['fake'] = df['fake'].map(label_map)
    clean_str = lambda text: text.replace('[','').replace(']','').strip().split()
    str_to_list = lambda text: [literal_eval(number) for number in clean_str(text)]
    title_vector_list = list(map(str_to_list, df['title_vectors'].values))

    X = title_vector_list
    y = df['fake'].values

    X_train, X_test, y_train, y_test = train_test_split(X, y, test_size=0.3, random_state=42)

    X_train = np.array(X_train)
    X_test = np.array(X_test)
    y_train = np.array(y_train)
    y_test = np.array(y_test)

    #train and test


    logistic_model(X_train, y_train,X_test,y_test)#LogisticRegression

    XGB_model(X_train, y_train,X_test,y_test) #XGB

    RF_model(X_train, y_train,X_test,y_test) #RF

    SVM_model(X_train, y_train,X_test,y_test) #SVM

    KNN_model(X_train, y_train,X_test,y_test) #KNN

    AdaBoost_model(X_train, y_train,X_test,y_test) #Adaboost

    GradientBoost_model(X_train, y_train,X_test,y_test) #GradientBoost

    LDA_model(X_train, y_train,X_test,y_test) #LDA
