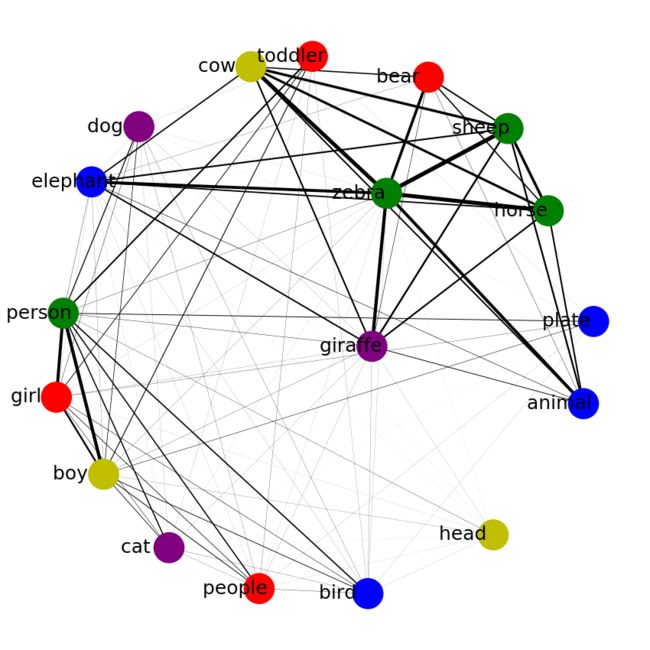
import networkx as nx
import matplotlib.pyplot as plt
import scipy.io as sio
import numpy as np

graph = sio.loadmat('./graph_sub_obj.mat')
classes = np.asarray(graph['classes'], dtype = np.str)
graph_obj = np.asarray(graph['graph_obj'], dtype = np.float)
graph_obj = graph_obj[:, :, 27]
graph_sub = np.asarray(graph['graph_sub'], dtype = np.float)
graph_sub = graph_sub[:, :, 27]

G = nx.Graph()
for i in range(graph_obj.shape[0]):
    for j in range(graph_obj.shape[1]):
        if graph_obj[i, j] > 0:
            G.add_edge(classes[i], classes[j], weight = graph_obj[i, j])

fig = plt.gcf()
fig.set_size_inches(8.5, 8.5)
colors = ['r', 'g', 'b', 'y', 'purple']
pos = nx.spring_layout(G, iterations=50, scale = 0.1)
edgewidth=[]
for (u,v,d) in G.edges(data=True):
     edgewidth.append(round(G.get_edge_data(u,v).values()[0]*20, 2))
nx.draw_networkx(G, pos, node_color=colors, node_size=800, font_size=18, with_labels=True, width = edgewidth)
#nx.draw_networkx(G,pos=nx.spring_layout(G),node_color=colors)
#nx.draw_networkx(G,pos=nx.circular_layout(G),node_color=colors)
#nx.draw_networkx(G,pos=nx.random_layout(G),node_color=colors)
#nx.draw_networkx(G,pos=nx.shell_layout(G),node_color=colors)
plt.tick_params(labelbottom='off', labelleft='off')
plt.axis('off')
plt.subplots_adjust(top=1,bottom=0, left=0, right=1, hspace=0, wspace=0)
plt.savefig('graph_obj.png', dpi=100)
plt.show()

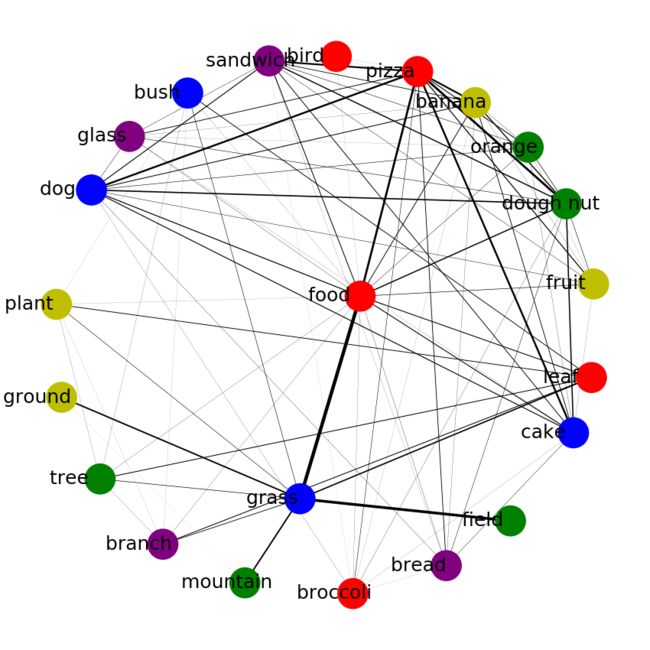
G = nx.Graph()
for i in range(graph_sub.shape[0]):
    for j in range(graph_sub.shape[1]):
        if graph_sub[i, j] > 0:
            G.add_edge(classes[i], classes[j], weight = graph_sub[i, j])

fig = plt.gcf()
fig.set_size_inches(8.5, 8.5)
colors = ['r', 'g', 'b', 'y', 'purple']
pos = nx.spring_layout(G, iterations=50, scale = 0.1)
edgewidth=[]
for (u,v,d) in G.edges(data=True):
     edgewidth.append(round(G.get_edge_data(u,v).values()[0]*20, 2))
nx.draw_networkx(G, pos, node_color=colors, node_size=800, font_size=18, with_labels=True, width = edgewidth)
#nx.draw_networkx(G,pos=nx.spring_layout(G),node_color=colors)
#nx.draw_networkx(G,pos=nx.circular_layout(G),node_color=colors)
#nx.draw_networkx(G,pos=nx.random_layout(G),node_color=colors)
#nx.draw_networkx(G,pos=nx.shell_layout(G),node_color=colors)
plt.tick_params(labelbottom='off', labelleft='off')
plt.axis('off')
plt.subplots_adjust(top=1,bottom=0, left=0, right=1, hspace=0, wspace=0)
plt.savefig('graph_sub.png', dpi=100)
plt.show()


