【数据分析】盘点五一期间最受欢迎的几个景区
戳蓝字“CSDN云计算”关注我们哦!
五一假期已经结束,小伙伴是不是都还没有玩过瘾?但是没办法,还有很多bug等着我们去写,同样还有需要money需要我们去赚。为了生活总的拼搏。
今年五一放了四天假,很多人不再只是选择周边游,因为时间充裕,选择了稍微远一点的景区,甚至出国游。各个景点成了人山人海,拥挤的人群,甚至去卫生间都要排队半天,那一刻我突然有点理解灭霸的行为了。
今天,通过分析去哪儿网部分城市门票售卖情况,简单的分析一下哪些景点比较受欢迎。等下次假期可以做个参考。
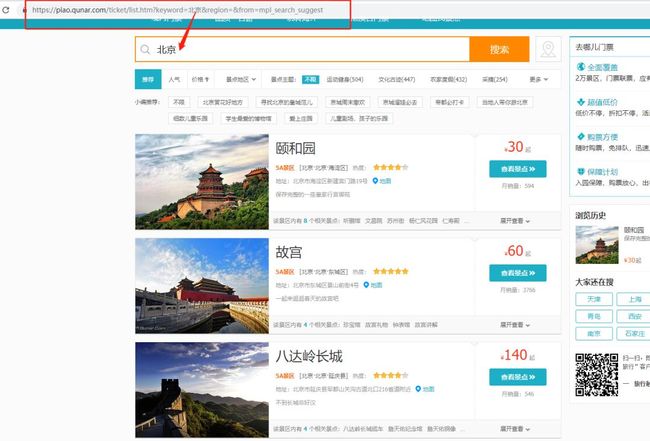
通过请求https://piao.qunar.com/ticket/list.htm?keyword=北京,获取北京地区热门景区信息,再通过BeautifulSoup去分析提取出我们需要的信息。
这里为了偷懒只爬取了前4页的景点信息,每页有15个景点。因为去哪儿并没有什么反爬措施,所以直接请求就可以了。
这里只是随机选择了13个热门城市:北京, 上海, 成都, 三亚, 广州, 重庆, 深圳, 西安, 杭州, 厦门, 武汉, 大连, 苏州。
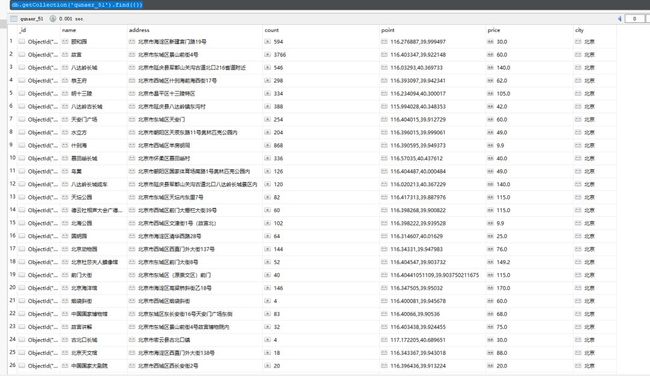
并将爬取的数据存到了MongoDB数据库 。
爬虫部分完整代码如下
import requestsfrom bs4 import BeautifulSoupfrom pymongo import MongoClientclass QuNaEr():    def __init__(self, keyword, page=1):        self.keyword = keyword        self.page = page    def qne_spider(self):        url = 'https://piao.qunar.com/ticket/list.htm?keyword=%s®ion=&from=mpl_search_suggest&page=%s' % (self.keyword, self.page)        response = requests.get(url)        response.encoding = 'utf-8'        text = response.text        bs_obj = BeautifulSoup(text, 'html.parser')        arr = bs_obj.find('div', {'class': 'result_list'}).contents        for i in arr:            info = i.attrs            # 景区名称            name = info.get('data-sight-name')            # 地址            address = info.get('data-address')            # 近期售票数            count = info.get('data-sale-count')            # 经纬度            point = info.get('data-point')            # 起始价格            price = i.find('span', {'class': 'sight_item_price'})            price = price.find_all('em')            price = price[0].text            conn = MongoClient('localhost', port=27017)            db = conn.QuNaEr # 库            table = db.qunaer_51 # 表            table.insert_one({                'name'      :   name,                'address'   :   address,                'count'     :   int(count),                'point'     :   point,                'price'     :   float(price),                'city'      :   self.keyword            })if __name__ == '__main__':    citys = ['北京', '上海', '成都', '三亚', '广州', '重庆', '深圳', '西安', '杭州', '厦门', '武汉', '大连', '苏州']    for i in citys:        for page in range(1, 5):            qne = QuNaEr(i, page=page)            qne.qne_spider()
from bs4 import BeautifulSoup
from pymongo import MongoClient

class QuNaEr():
    def __init__(self, keyword, page=1):
        self.keyword = keyword
        self.page = page

    def qne_spider(self):
        url = 'https://piao.qunar.com/ticket/list.htm?keyword=%s®ion=&from=mpl_search_suggest&page=%s' % (self.keyword, self.page)
        response = requests.get(url)
        response.encoding = 'utf-8'
        text = response.text
        bs_obj = BeautifulSoup(text, 'html.parser')

        arr = bs_obj.find('div', {'class': 'result_list'}).contents
        for i in arr:
            info = i.attrs
            # 景区名称
            name = info.get('data-sight-name')
            # 地址
            address = info.get('data-address')
            # 近期售票数
            count = info.get('data-sale-count')
            # 经纬度
            point = info.get('data-point')

            # 起始价格
            price = i.find('span', {'class': 'sight_item_price'})
            price = price.find_all('em')
            price = price[0].text

            conn = MongoClient('localhost', port=27017)
            db = conn.QuNaEr # 库
            table = db.qunaer_51 # 表

            table.insert_one({
                'name'      :   name,
                'address'   :   address,
                'count'     :   int(count),
                'point'     :   point,
                'price'     :   float(price),
                'city'      :   self.keyword
            })


if __name__ == '__main__':
    citys = ['北京', '上海', '成都', '三亚', '广州', '重庆', '深圳', '西安', '杭州', '厦门', '武汉', '大连', '苏州']
    for i in citys:
        for page in range(1, 5):
            qne = QuNaEr(i, page=page)
            qne.qne_spider()
效果图如下
有了数据,我们就可以分析出自己想要的东西了
1、最受欢迎的15个景区
由图可以看出,在选择的13个城市中,最热门的景区为上海的迪士尼乐园
代码如下
from pymongo import MongoClient# 设置字体,不然无法显示中文from pylab import *mpl.rcParams['font.sans-serif'] = ['SimHei']conn = MongoClient('localhost', port=27017)db = conn.QuNaEr # 库table = db.qunaer_51 # 表result = table.find().sort([('count', -1)]).limit(15)# x,y轴数据x_arr = []  # 景区名称y_arr = []  # 销量for i in result:    x_arr.append(i['name'])    y_arr.append(i['count'])"""去哪儿月销量排行榜"""plt.bar(x_arr, y_arr, color='rgb')  # 指定color,不然所有的柱体都会是一个颜色plt.gcf().autofmt_xdate() # 旋转x轴,避免重叠plt.xlabel(u'景点名称')  # x轴描述信息plt.ylabel(u'月销量')  # y轴描述信息plt.title(u'拉钩景点月销量统计表')  # 指定图表描述信息plt.ylim(0, 4000)  # 指定Y轴的高度plt.savefig('去哪儿月销售量排行榜')  # 保存为图片plt.show()import MongoClient
# 设置字体,不然无法显示中文
from pylab import *

mpl.rcParams['font.sans-serif'] = ['SimHei']

conn = MongoClient('localhost', port=27017)
db = conn.QuNaEr # 库
table = db.qunaer_51 # 表

result = table.find().sort([('count', -1)]).limit(15)
# x,y轴数据
x_arr = []  # 景区名称
y_arr = []  # 销量
for i in result:
    x_arr.append(i['name'])
    y_arr.append(i['count'])

"""
去哪儿月销量排行榜
"""
plt.bar(x_arr, y_arr, color='rgb')  # 指定color,不然所有的柱体都会是一个颜色
plt.gcf().autofmt_xdate() # 旋转x轴,避免重叠
plt.xlabel(u'景点名称')  # x轴描述信息
plt.ylabel(u'月销量')  # y轴描述信息
plt.title(u'拉钩景点月销量统计表')  # 指定图表描述信息
plt.ylim(0, 4000)  # 指定Y轴的高度
plt.savefig('去哪儿月销售量排行榜')  # 保存为图片
plt.show()
2、景区热力图
这里为了方(tou)便(lan),只展示一下北京地区的景区热力图。用到了百度地图的开放平台。首先需要先注册开发者信息,首页底部有个申请秘钥的按钮,点击进行创建就可以了。我的应用类型选择的是浏览器端,因此只需要组装数据替换掉相应html代码即可。另外还需要将自己访问应用的AK替换掉。效果图如下
3、景区价格
价格是出游第一个要考虑的,一开始想统计一下各城市的平均价格,但是后来发现效果不是很好,比如北京的刘老根大舞台价格在580元,这样拉高了平均价格。就好比姚明和潘长江的平均身高在190cm,并没有什么说服力。所以索性展示一下景区的价格分布。
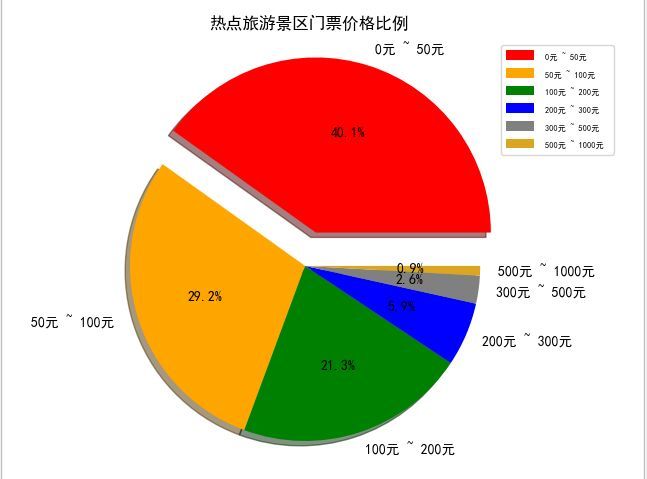
根据价格设置了六个区间
通过上图得知,大部分的景区门票价格都在200元以下。每次旅游花费基本都在交通、住宿、吃吃喝喝上了。门票占比还是比较少的。
代码如下
arr = [[0, 50], [50,100], [100, 200], [200,300], [300,500], [500,1000]]name_arr = []total_arr = []for i in arr:    result = table.count({'price': {'$gte': i[0], '$lt': i[1]}})    name = '%s元 ~ %s元 ' % (i[0], i[1])    name_arr.append(name)    total_arr.append(result)color = 'red', 'orange', 'green', 'blue', 'gray', 'goldenrod' # 各类别颜色explode = (0.2, 0, 0, 0, 0, 0)  # 各类别的偏移半径# 绘制饼状图pie = plt.pie(total_arr, colors=color, explode=explode, labels=name_arr, shadow=True, autopct='%1.1f%%')plt.axis('equal')plt.title(u'热点旅游景区门票价格比例', fontsize=12)plt.legend(loc=0, bbox_to_anchor=(0.82, 1))  # 图例# 设置legend的字体大小leg = plt.gca().get_legend()ltext = leg.get_texts()plt.setp(ltext, fontsize=6)# 显示图plt.show()50], [50,100], [100, 200], [200,300], [300,500], [500,1000]]
name_arr = []
total_arr = []
for i in arr:
    result = table.count({'price': {'$gte': i[0], '$lt': i[1]}})
    name = '%s元 ~ %s元 ' % (i[0], i[1])
    name_arr.append(name)
    total_arr.append(result)

color = 'red', 'orange', 'green', 'blue', 'gray', 'goldenrod' # 各类别颜色
explode = (0.2, 0, 0, 0, 0, 0)  # 各类别的偏移半径

# 绘制饼状图
pie = plt.pie(total_arr, colors=color, explode=explode, labels=name_arr, shadow=True, autopct='%1.1f%%')

plt.axis('equal')
plt.title(u'热点旅游景区门票价格比例', fontsize=12)

plt.legend(loc=0, bbox_to_anchor=(0.82, 1))  # 图例
# 设置legend的字体大小
leg = plt.gca().get_legend()
ltext = leg.get_texts()
plt.setp(ltext, fontsize=6)
# 显示图
plt.show()
以上分析结果仅供参考
![]()
福利
扫描添加小编微信,备注“姓名+公司职位”,加入【云计算学习交流群】,和志同道合的朋友们共同打卡学习!
推荐阅读:
太形象了!什么是边缘计算?最有趣的解释没有之一!
互联网出海十年
华为员工年薪 200 万!真相让人心酸!
天才程序员:25 岁进贝尔实验室,32 岁创建信息论 琥珀 极客宝宝 5天前
安全顾问反水成黑客, 靠瞎猜盗得5000万美元的以太币, 一个区块链大盗的另类传奇
人造器官新突破!美国科学家3D打印出会“呼吸”的肺 | Science


