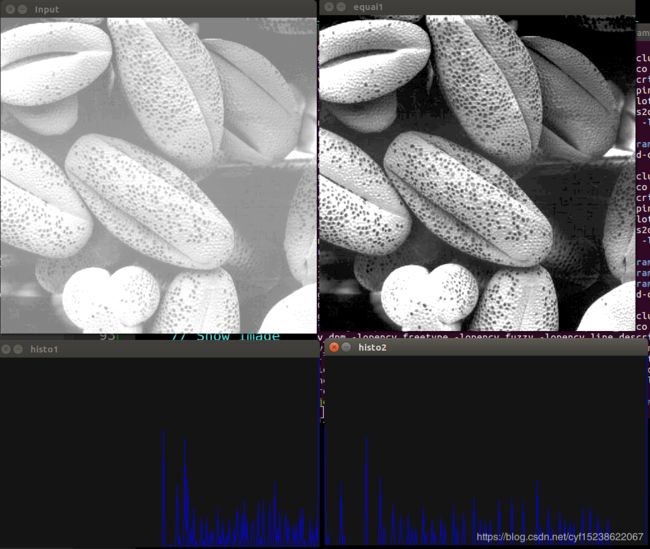
OpenCV灰度图的直方图均衡化 C++
• 图像直方图的定义1:
一个灰度级在范围[0,L-1]的数字图像的直 方图是一个离散函数
h(rk)= nk ,
nk是图像中灰度级为rk的像素个数, rk 是第k个灰度级,k = 0,1,2,…,L-1
由于rk的增量是1,直方图可表示为: p(k)= nk 即,图像中不同灰度级像素出现的次数。
• 图像直方图的定义2:
一个灰度级在范围[0,L-1]的数字图像的直 方图是一个离散函数
p(rk)= nk/n
n 是图像的像素总数
nk是图像中灰度级为rk的像素个数 , rk 是第k个灰度级,k = 0,1,2,…,L-1
其中,定义(2)
✓ 使函数值正则化到[0,1]区间,成为实数函 数
✓ 函数值的范围与象素的总数无关
✓ 给出灰度级rk在图像中出现的概率密度统计
直方图均衡化是通过调整图像的灰阶分布,使得在0~255灰阶上的分布更加均衡,提高了图像的对比度,达到改善图像主观视觉效果的目的。对比度较低的图像适合使用直方图均衡化方法来增强图像细节。
绘制一幅灰度图的直方图
代码如下:
#include
#include
#include "opencv2/core.hpp"
#include "opencv2/imgproc.hpp"
#include "opencv2/highgui.hpp"
using namespace cv;
using namespace std;
const char* keys =
{
"{help h usage ? | | print this message}"
"{@image | | Image to process}"
};
Mat equalize_img( Mat &src_img )
{
Mat result;
equalizeHist( src_img, result );
return result;
}
Mat show_img_histogram( Mat &src_img )
{
//create 256 subinterval
//the number of possibles values
int numbins = 256;
//set the range for BGR(0-256)
float range[] = { 0, 256};
const float* histRange = { range };
Mat gray_hist;
calcHist( &src_img, 1, 0, Mat(), gray_hist, 1, &numbins, &histRange );
//draw histogram
//draw lines for each channels
int width = 512;
int height = 300;
// Create image with gray base
Mat histImage( height, width, CV_8UC3, Scalar(20, 20, 20) );
// Normalize the histograms to height of image
normalize(gray_hist, gray_hist, 0, height, NORM_MINMAX );
int binStep= cvRound((float)width/(float)numbins);
for( int i=1; i< numbins; i++){
line(
histImage,
Point( binStep*(i-1), height-cvRound(gray_hist.at
Point( binStep*(i), height-cvRound(gray_hist.at
Scalar(255,0,0)
);
}
return histImage;
}
int main( int argc, char* argv[] )
{
CommandLineParser parser(argc, argv, keys);
parser.about("Chapter 4. PhotoTool v1.0.0");
//If requires help show
if (parser.has("help")){
parser.printMessage();
return 0;
}
String imgFile= parser.get
// Check if params are correctly parsed in his variables
if (!parser.check()){
parser.printErrors();
return 0;
}
// Load image to process
Mat img= imread(imgFile);
if( !img.data ){
fprintf( stderr, "Can't read image\n" );
return -1;
}
Mat srcGray;
cv::cvtColor(img, srcGray, CV_BGR2GRAY);
Mat histo1 = show_img_histogram(srcGray);
Mat equai1 = equalize_img(srcGray);
Mat histo2 = show_img_histogram(equai1);
// Show image
namedWindow("Input");
imshow("Input", srcGray);
imshow("histo1", histo1);
imshow("equai1", equai1);
imshow("histo2", histo2);
waitKey(0);
return 0;
}
效果如下:
