seaborn —— 课后练✋
%matplotlib inline
import numpy as np
import pandas as pd
from scipy import stats, integrate
import matplotlib as mpl
from matplotlib import pyplot as plt
import seaborn as sns
练习1:鸢尾花花型尺寸分析
- 鸢尾花萼片(sepal)和花瓣(petal)的大小关系(散点图)
- 不同种类(species)鸢尾花萼片和花瓣的分布情况(箱图或者提琴图)
- 鸢尾花萼片和花瓣大小的联合分布情况(六角箱图或者核密度估计)
data = sns.load_dataset("iris")
data.head()
|
sepal_length |
sepal_width |
petal_length |
petal_width |
species |
| 0 |
5.1 |
3.5 |
1.4 |
0.2 |
setosa |
| 1 |
4.9 |
3.0 |
1.4 |
0.2 |
setosa |
| 2 |
4.7 |
3.2 |
1.3 |
0.2 |
setosa |
| 3 |
4.6 |
3.1 |
1.5 |
0.2 |
setosa |
| 4 |
5.0 |
3.6 |
1.4 |
0.2 |
setosa |
data['sepal_size']=data['sepal_length']*data['sepal_width']
data['petal_size']=data['petal_length']*data['petal_width']
萼片与花瓣
sns.lmplot(x='sepal_size',y='petal_size',data=data)

不同种类 萼片与花瓣分布
g = sns.PairGrid(data,
                 x_vars=["species"],
                 y_vars=["sepal_size", "petal_size"],
                 aspect=2, size=4)
g.map(sns.violinplot, palette="pastel");

萼片与花瓣大小联合分布
sns.jointplot(x='sepal_length',y='petal_length',data=data,kind='kde')
/opt/ds/local/lib/python2.7/site-packages/numpy/ma/core.py:6385: MaskedArrayFutureWarning: In the future the default for ma.minimum.reduce will be axis=0, not the current None, to match np.minimum.reduce. Explicitly pass 0 or None to silence this warning.
  return self.reduce(a)
/opt/ds/local/lib/python2.7/site-packages/numpy/ma/core.py:6385: MaskedArrayFutureWarning: In the future the default for ma.maximum.reduce will be axis=0, not the current None, to match np.maximum.reduce. Explicitly pass 0 or None to silence this warning.
  return self.reduce(a)

练习2:餐厅小费情况分析
- 小费和总消费之间的关系(散点图+回归分析)
- 男性顾客和女性顾客,谁更慷慨(箱图或者提琴图)
- 抽烟与否是否会对小费金额产生影响(箱图或者提琴图)
- 工作日和周末,什么时候顾客给的小费更慷慨(箱图或者提琴图)
- 午饭和晚饭,哪一顿顾客更愿意给小费(箱图或者提琴图)
- 就餐人数是否会对慷慨度产生影响(箱图或者提琴图)
- 性别+抽烟的组合因素对慷慨度的影响(统计柱状图)
data = sns.load_dataset("tips")
data.head()
|
total_bill |
tip |
sex |
smoker |
day |
time |
size |
| 0 |
16.99 |
1.01 |
Female |
No |
Sun |
Dinner |
2 |
| 1 |
10.34 |
1.66 |
Male |
No |
Sun |
Dinner |
3 |
| 2 |
21.01 |
3.50 |
Male |
No |
Sun |
Dinner |
3 |
| 3 |
23.68 |
3.31 |
Male |
No |
Sun |
Dinner |
2 |
| 4 |
24.59 |
3.61 |
Female |
No |
Sun |
Dinner |
4 |
小费与总消费
sns.lmplot(x='total_bill',y='tip',data=data)

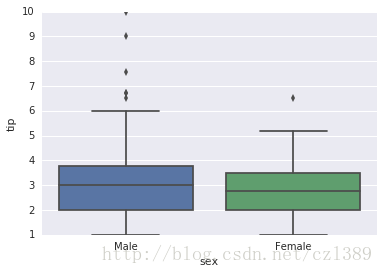
小费:男性vs女性
sns.boxplot(y='tip',x='sex',data=data)
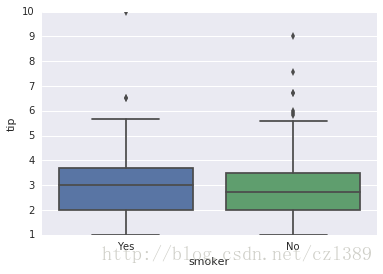
小费:抽烟vs不抽烟
sns.boxplot(y='tip',x='smoker',data=data)
小费:工作日vs周末
day=data['day'].unique()
day
[Sun, Sat, Thur, Fri] Categories (4, object): [Sun, Sat, Thur, Fri]
data_week=pd.DataFrame(('weekend' if x in ['Sun','Sat'] else 'weekday' for x in data.day),index=data.index,columns=['week'])
data_expand=pd.merge(data,data_week,left_index=True,right_index=True)
data_expand.head()
|
total_bill |
tip |
sex |
smoker |
day |
time |
size |
week |
| 0 |
16.99 |
1.01 |
Female |
No |
Sun |
Dinner |
2 |
weekend |
| 1 |
10.34 |
1.66 |
Male |
No |
Sun |
Dinner |
3 |
weekend |
| 2 |
21.01 |
3.50 |
Male |
No |
Sun |
Dinner |
3 |
weekend |
| 3 |
23.68 |
3.31 |
Male |
No |
Sun |
Dinner |
2 |
weekend |
| 4 |
24.59 |
3.61 |
Female |
No |
Sun |
Dinner |
4 |
weekend |
sns.boxplot(y='tip',x='week',data=data_expand)

小费:午餐vs晚餐
sns.violinplot(x='time',y='tip',data=data)

小费:就餐人数
sns.violinplot(x='size',y='tip',data=data)

小费:性别+抽烟
sns.barplot(x='sex',y='tip',hue='smoker',data=data)

练习3:泰坦尼克号海难幸存状况分析
- 不同仓位等级中幸存和遇难乘客的分布(箱图或者提琴图)
- 幸存和遇难乘客的票价分布(箱图或者提琴图)
- 幸存和遇难乘客的年龄分布(箱图或者提琴图)
- 不同上船港口的乘客仓位等级分布(箱图或者提琴图)
- 幸存和遇难乘客堂兄弟姐妹的数量分布(箱图或者提琴图)
- 幸存和遇难乘客父母子女的数量分布(箱图或者提琴图)
- 单独乘船与否和幸存之间的关系(统计柱状图)
- 乘客年龄和船票价格之间的关系(线性回归模型)
- 乘客性别和仓位等级之间的关系(统计柱状图)
- 乘客年龄和仓位等级之间的关系(带抖动的散点图)
data = sns.load_dataset("titanic")
data.head()
|
survived |
pclass |
sex |
age |
sibsp |
parch |
fare |
embarked |
class |
who |
adult_male |
deck |
embark_town |
alive |
alone |
| 0 |
0 |
3 |
male |
22.0 |
1 |
0 |
7.2500 |
S |
Third |
man |
True |
NaN |
Southampton |
no |
False |
| 1 |
1 |
1 |
female |
38.0 |
1 |
0 |
71.2833 |
C |
First |
woman |
False |
C |
Cherbourg |
yes |
False |
| 2 |
1 |
3 |
female |
26.0 |
0 |
0 |
7.9250 |
S |
Third |
woman |
False |
NaN |
Southampton |
yes |
True |
| 3 |
1 |
1 |
female |
35.0 |
1 |
0 |
53.1000 |
S |
First |
woman |
False |
C |
Southampton |
yes |
False |
| 4 |
0 |
3 |
male |
35.0 |
0 |
0 |
8.0500 |
S |
Third |
man |
True |
NaN |
Southampton |
no |
True |
幸存or遇难:不同仓位影响?
sns.violinplot(x='class',y='survived',data=data)

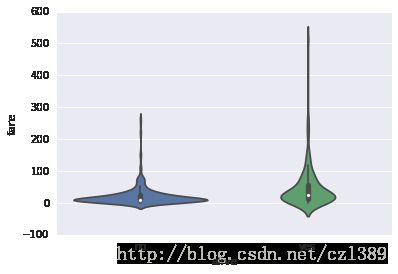
幸存or遇难:票价分布?
sns.violinplot(x='alive',y='fare',data=data)
幸存or遇难:年龄分布?
sns.violinplot(x='alive',y='age',data=data)

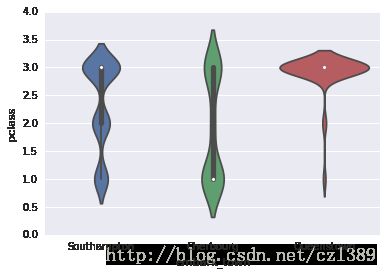
不同上船港口的仓位等级分布
sns.violinplot(x='embark_town',y='pclass',data=data)
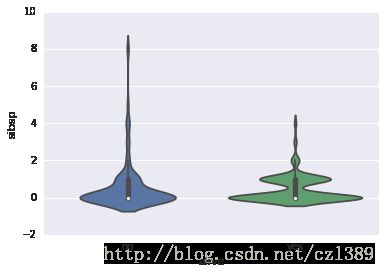
幸存or遇难:堂兄弟姐妹数量分布?
sns.violinplot(x='alive',y='sibsp',data=data)
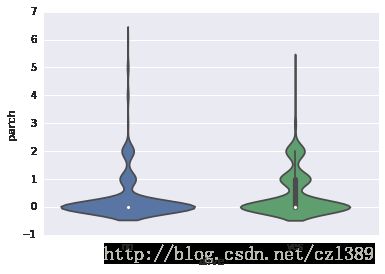
幸存or遇难:父母子女数量分布?
sns.violinplot(x='alive',y='parch',data=data)
幸存or遇难:是否单独乘船?
sns.barplot(x='alone',y='survived',data=data)

年龄与票价的关系
sns.lmplot(x='age',y='fare',data=data)

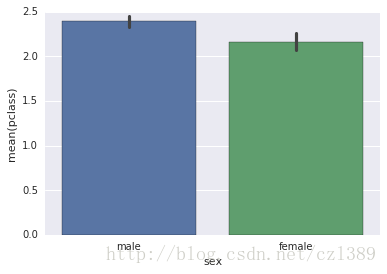
性别与仓位等级
sns.barplot(x='sex',y='pclass',data=data)
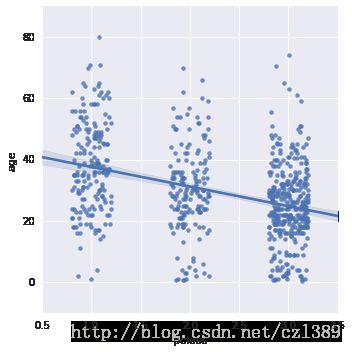
乘客年龄与仓位等级的关系
sns.lmplot(x='pclass',y='age',data=data,x_jitter=0.2)