前言
此本中收录一些较复杂统计图案例的实现分析,希望能给需要的朋友带来灵感。
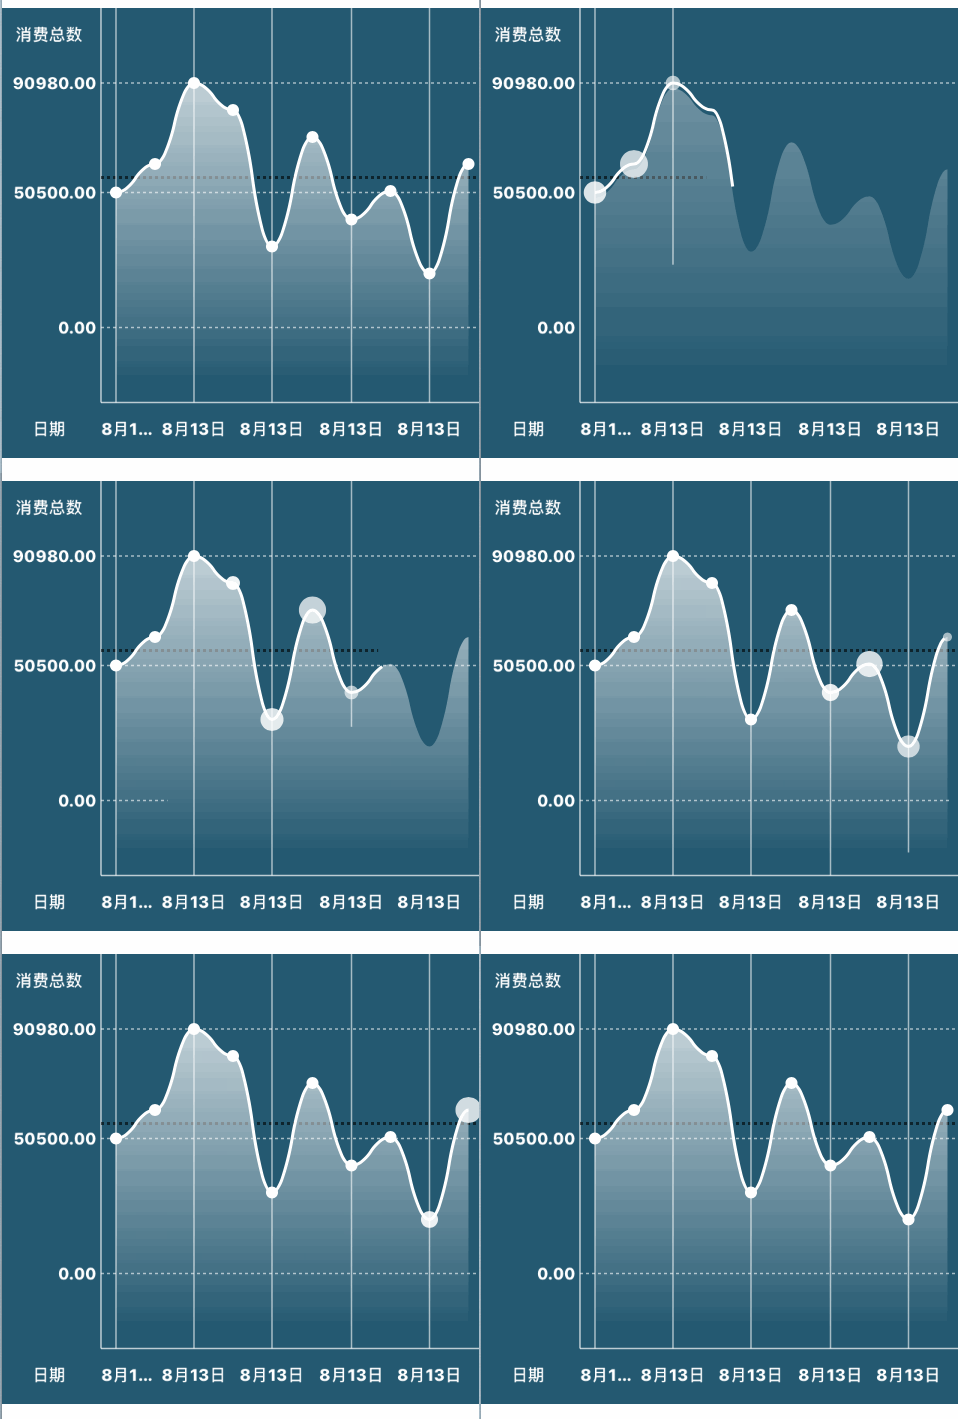
曲线动态图
绘制关键步骤:
我们可以看到上图的动图是一组组合动画,共有四部分组成:坐标横竖虚线的动画、曲线的动态绘制、小圆点的动画、渐变区域的动画。下面逐个分析
-
坐标横竖虚线的动画
第一步设置一个 CAShapeLayer 并设置 .lineDashPattern 属性,使之成为虚线。下面一步很关键,生成一条 UIBezierPath,使用for循环如下:for (NSInteger idx = 0; idx < horizontalLineCount; ++idx) { yValue = [self.parentView.datasource lineChartView:self.parentView valueReferToHorizontalReferenceLineAtIndex:idx]; yLocation = [self.parentView.calculator verticalLocationForValue:yValue]; [horizontalReferencePath moveToPoint:CGPointMake(0, yLocation)]; [horizontalReferencePath addLineToPoint:CGPointMake(boundsWidth, yLocation)]; }
通过多次调用 moveToPoint,addLineToPoint,于是这条UIBezierPath就包含了三段直线,把UIBezierPath 赋值给CAShapeLayer后,直接对 CAShapeLayer的strokeEnd 作CABasicAnimation动画,就会出现,三条横线依次出现的动画,很巧妙,而不是你看到的初始化三条UIBezierPath。同时对横竖方向的CAShapeLayer做动画,就会出现如图所示的效果。
曲线动画
这部分的重点是使用 贝塞尔曲线的拼接曲线的方法:
addCurveToPoint 三次贝塞尔曲线,需要两个控制点
addQuadCurveToPoint 二次贝塞尔曲线,需要一个控制点
关键是根据数值,计算出各个控制点,调用绘图方法绘制曲线路径。最后对CAShapeLayer的strokeEnd 作CABasicAnimation动画即可实现。-
小圆点的动画
根据数据源,在每一数据点处放上一个自定义UIView,在此自定义UIView的drawRect中绘制圆形图形,并且设置 shape.layer.opacity = 0;,即让这些小圆点(很多UIView)刚开始的是不显示的,加载在当前的UIView上,计算每一个点的动画开始时间,达到小圆点依次作动画的效果。对每一个圆点调用下面方法:- (void)addScaleSpringAnimationForView:(UIView *)view reverse:(BOOL)isReverse delay:(CGFloat)delay forKeyPath:(NSString *)keyPath { CAKeyframeAnimation *animation = [CAKeyframeAnimation animationWithKeyPath:@"transform.scale"]; animation.keyTimes = !isReverse ? @[@0.05, @0.5, @0.9] : @[@0.5, @0.9]; animation.values = !isReverse ? @[@0.01, @2.5, @1.0] : @[@2.5, @0.01]; CABasicAnimation *baseAnimation = [CABasicAnimation animationWithKeyPath:@"opacity"]; baseAnimation.fromValue = isReverse ? @1.0 : @0.5; baseAnimation.toValue = isReverse ? @0.5 : @1.0; CAAnimationGroup *groundAnimation = [[CAAnimationGroup alloc] init]; groundAnimation.duration = 0.5; groundAnimation.speed = 0.5; groundAnimation.animations = @[animation, baseAnimation]; groundAnimation.delegate = self; groundAnimation.beginTime = CACurrentMediaTime() + delay; [groundAnimation setValue:view.layer forKey:keyPath]; //******************** [view.layer addAnimation:groundAnimation forKey:nil]; } - (void)animationDidStop:(CAAnimation *)anim finished:(BOOL)flag { CALayer *layer = [anim valueForKeyPath:@"original"]; if (layer) { layer.opacity = 1.0; [anim setValue:nil forKeyPath:@"original"]; } }我们注意到,上面的动画是一个组合动画,让圆点透明度变大,形状先变大后变小的动画。这里要注意一点的是为了使用动画的代理,区分动画,我们使用了
[groundAnimation setValue:view.layer forKey:keyPath];因为最开始时小圆点是不显示的,但是动画结束后我们需要它显示,所以在动画的代理里 设置动画的 layer.opacity = 1.0;使其一直显示。
渐变区域的动画
我们仔细观察上图会发现,渐变区域的动画是这样的,先慢慢变清晰,同时波浪往上移动的效果,它是怎样实现的呢?
首先我们设置一个渐变图层 CAGradientLayer,下面是CAGradientLayer基本介绍
CAGradientLayer可以方便的处理颜色渐变,它有以下几个主要的属性:
@property(copy) NSArray *colors 渐变颜色的数组
@property(copy) NSArray *locations 渐变颜色的区间分布,locations的数组长度和color一致,默认是nil,会平均分布。
@property CGPoint startPoint 映射locations中第一个位置,用单位向量表示,比如(0,0)表示从左上角开始变化。默认值是(0.5,0.0)。
@property CGPoint endPoint 映射locations中最后一个位置,用单位向量表示,比如(1,1)表示到右下角变化结束。默认值是(0.5,1.0)。
我们本例中的设置是这样的
    gradientLayer.colors = @[[UIColor colorWithWhite:1.0 alpha:0.9], [UIColor colorWithWhite:1.0 alpha:0.0]];
    gradientLayer.locations = @[@(0.0), @(0.95)];
    因为 渐变图层默认是从上到下均匀渲染的,此处的设置的意思是顶部的是 透明度为0.9的白色
   底部0.95的地方开始是透明度为0的白色,
    # 整个设置的意思是说,底部0.5比例处开始向上颜色渐变,并且是越来越白,顶部的白是0.9透明度的白色。
设置渐变图层的 mask(遮罩层)为一个CAShapeLayer
     maskLayer = [CAShapeLayer layer];
    maskLayer.strokeColor = [UIColor clearColor].CGColor;
    maskLayer.fillColor = [UIColor blackColor].CGColor;
    gradientLayer.mask = maskLayer;
我们在上面绘制曲线路径的时候已经得到一个UIBezierPath,把这个路径拼接上X坐标轴上的两个垂直投影点形成一个底部矩形状的封闭路径,把个路径作为渐变图层的path,并绘制一条比这个UIBezierPath顶部低一点的路径作为 渐变图层的遮罩图层(maskLayer)的路径 LowBezierPath。
    //animation for gradient
    animation = [CABasicAnimation animationWithKeyPath:@"opacity"];
    animation.duration = _animationDuration;
    animation.speed = 1.5;
    animation.fromValue = @0.0;
    animation.toValue = @1.0;

    costarAnimation = [CABasicAnimation animationWithKeyPath:@"path"];
    costarAnimation.duration = _animationDuration;
    costarAnimation.speed = 1.5;
    costarAnimation.fromValue = (__bridge id _Nullable)(gradientPathLower.CGPath);
    costarAnimation.toValue = (__bridge id _Nullable)(gradientPath.CGPath);
     //********************
    [gradientLayer addAnimation:animation forKey:nil];
    [maskLayer addAnimation:costarAnimation forKey:nil];
对渐变图层和渐变图层的 遮罩层同时做CABasicAnimation动画,渐变图层渐渐显现,渐变图层的遮罩图层由 低路径过渡到高路径,就有了上图中渐变图层渐渐显现并逐渐身高的效果。
在使用drawRect:重绘页面时注意首先移除已有的图层maskLayer 同时做动画。
    - (void)drawRect:(CGRect)rect {
    //remove sublayer
    [[self subviews] makeObjectsPerformSelector:@selector(removeFromSuperview)];
    [[self.layer sublayers] makeObjectsPerformSelector:@selector(removeFromSuperlayer)];
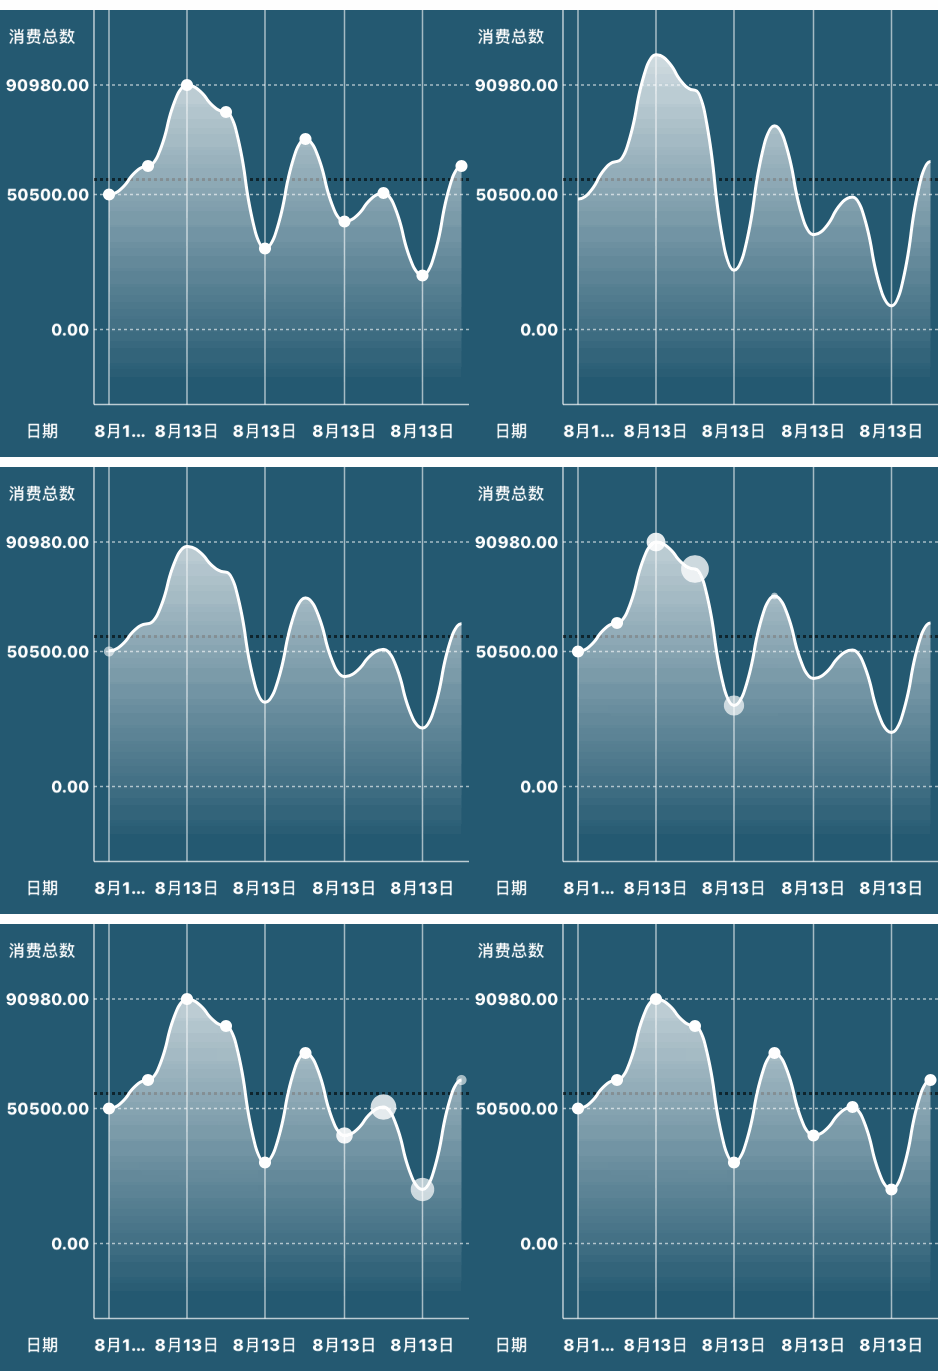
带弹性的曲线图
整个效果的实现过程是这样的:
-
触发UIView的 drawRect 方法;
 [_lineGraph setNeedsDisplay];
 **使用 setNeedsDisplay **
在 drawRect 中 对小白点的动画延迟到 x 秒后,弹性动画开始的延迟时间为 0秒持续 x秒,这样就可以保证在弹性动画结束后,开始小白点的动画。
-
弹性动画效果
    if (!_displayLink) {
          _displayLink = [CADisplayLink displayLinkWithTarget:self selector:@selector(handleWaveFrameUpdate)];
          [_displayLink addToRunLoop:[NSRunLoop mainRunLoop] forMode:NSDefaultRunLoopMode];
          _displayLink.paused = true;
      }

      __block UIView *shape;
      CGFloat middleY = (firstPoint.y + lastPoint.y) / 2;
      NSMutableArray *controlPoints = [NSMutableArray array];
      [_parentView.points enumerateObjectsUsingBlock:^(WYLineChartPoint * point, NSUInteger idx, BOOL * _Nonnull stop) {

          shape = [[UIView alloc] initWithFrame:CGRectMake(0, 0, 2, 2)];

          shape.center = CGPointMake(point.x, 2*middleY-point.y/* - _parentView.lineBottomMargin*/);
          shape.backgroundColor = [UIColor clearColor];
          [self addSubview:shape];
          [controlPoints addObject:shape];
      }];
      _animationControlPoints = controlPoints;

      _displayLink.paused = false;
      self.userInteractionEnabled = false;
      [UIView animateWithDuration:_animationDuration + 0.5
                            delay:0.0
           usingSpringWithDamping:0.15
            initialSpringVelocity:1.40
                          options:0//UIViewAnimationOptionCurveEaseOut
                       animations:^{
                           [_animationControlPoints enumerateObjectsUsingBlock:^(UIView *view, NSUInteger idx, BOOL * _Nonnull stop) {
                               view.center = CGPointMake(view.center.x, ((WYLineChartPoint *)_parentView.points[idx]).y);
                           }];
                       } completion:^(BOOL finished) {
                           if (finished) {
                               _displayLink.paused = true;
                               self.userInteractionEnabled = true;
                           }
                       }];
(1) 首先开启一个 CADisplayLink定时器,
(2) 根据曲线图上的点,初始化几个 子 View,X坐标跟曲线上点的X坐标一样,Y坐标的值 middleY-point.y+middleY 就是保证 初始化Y坐标是终坐标的关于中线的对称点。
(3) 开始弹性动画,设置子视图的终点,X坐标跟曲线上点的X坐标一样,Y坐标的值跟曲线上点的Y坐标一样。 ,在 completion 中对 CADisplayLink定时器暂停。
(4) 在弹性动画的执行期间,定时器会不断的获取某一时刻的所有的子视图的 坐标 ,并修改 曲线上的点的位置的坐标,并根据 currentLinePathForWave 这个方法绘制出 渐变图层的 mask的上沿的边界,然后绘制好整个完整的渐变图层的 mask的完成path并赋值。
(5) 由于定时器CADisplayLink 的执行速度很快,就达到了如图的效果。
定时器的代码如下:
  - (void)handleWaveFrameUpdate {

    [_parentView.points enumerateObjectsUsingBlock:^(WYLineChartPoint *point, NSUInteger idx, BOOL * _Nonnull stop) {
        UIView *view = _animationControlPoints[idx];
        point.x = [view wy_centerForPresentationLayer:true].x;
        point.y = [view wy_centerForPresentationLayer:true].y;
    }];

    UIBezierPath *linePath = [self currentLinePathForWave];
    _lineShapeLayer.path = linePath.CGPath;

    if (_parentView.drawGradient) {
        WYLineChartPoint *firstPoint, *lastPoint;
        firstPoint = [_parentView.points firstObject];
        lastPoint = [_parentView.points lastObject];

        UIBezierPath *gradientPath = [UIBezierPath bezierPathWithCGPath:linePath.CGPath];
        [gradientPath addLineToPoint:CGPointMake(lastPoint.x, self.wy_boundsHeight)];
        [gradientPath addLineToPoint:CGPointMake(firstPoint.x, self.wy_boundsHeight)];
        [gradientPath addLineToPoint:firstPoint.point];

        _gradientMaskLayer.path = gradientPath.CGPath;
    }
  }

  - (CGPoint)wy_centerForPresentationLayer:(BOOL)isPresentationLayer {
    //presentationLayer  是Layer的显示层(呈现层),需要动画提交之后才会有值。
    if (isPresentationLayer) {
        return ((CALayer *)self.layer.presentationLayer).position;
    }
      return self.center;
  }
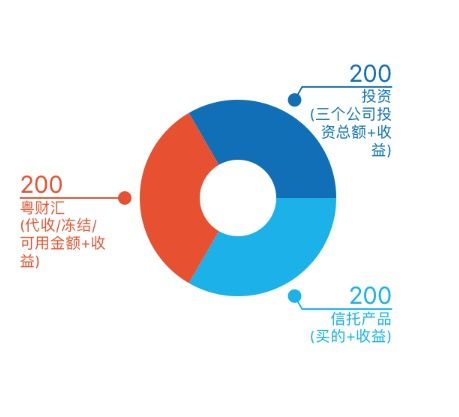
带标注的饼状图
绘制关键步骤:
使用for循环在 drawRect方法中绘制每一个扇形(上篇文章已将讲过),因为环外的标注,所以圆环需要小些,否则外环线上的文字绘制起来有可能空间不够。
根据每一个扇形的中心点位置,通过三角函数计算(三角函数中的参数是弧度,2π即为一个圆周 , iOS中为 M_PI*2,水平右侧为0)可以得到圆环外面的小圆的中心点。
通过数值的比例换算,得到每一个扇形的开始弧度和结束弧度值(0~M_PI*2).
得到每一个环外小圆的中心点坐标后,根据该点的X坐标值跟当前页面中心点的X坐标进行比较,确定小圆尾部的线的朝向以及字体的对其方向(在左侧字体向左对齐,在右边字体向右对齐)
-
环外圆点和直线使用CoreGraphics绘制,文字使用drawInRect: withAttributes绘制,字体左右对齐使用到以下方法:
 NSMutableParagraphStyle * paragraph = [[NSMutableParagraphStyle alloc]init];
   paragraph.alignment = NSTextAlignmentRight;
    if (lineEndPointX < [UIScreen mainScreen].bounds.size.width /2.0) {
       paragraph.alignment = NSTextAlignmentLeft;
 }
drawInRect:   withAttributes:@{NSParagraphStyleAttributeName:paragraph}
核心代码
-(void)drawArcWithCGContextRef:(CGContextRef)ctx
            andWithPoint:(CGPoint) point
      andWithAngle_start:(float)angle_start
        andWithAngle_end:(float)angle_end
            andWithColor:(UIColor *)color
                  andInt:(int)n {

  CGContextMoveToPoint(ctx, point.x, point.y);
  CGContextSetFillColor(ctx, CGColorGetComponents( color.CGColor));
  CGContextAddArc(ctx, point.x, point.y, _circleRadius,  angle_start, angle_end, 0);
  CGContextFillPath(ctx);
  弧度的中心角度
  CGFloat h = (angle_end + angle_start) / 2.0;
  使用三角函数计算,环外小圆的中心点坐标
  CGFloat xx = self.frame.size.width / 2 + (_circleRadius + 10) * cos(h);
  CGFloat yy = self.frame.size.height / 2 + (_circleRadius + 10) * sin(h);

  画环外的圆和直线
   [self addLineAndnumber:color andCGContextRef:ctx andX:xx andY:yy andInt:n angele:h];
 }
股票K线图
本文参考
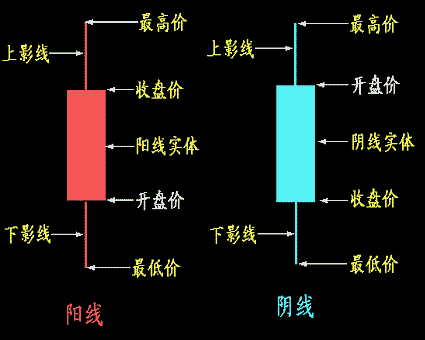
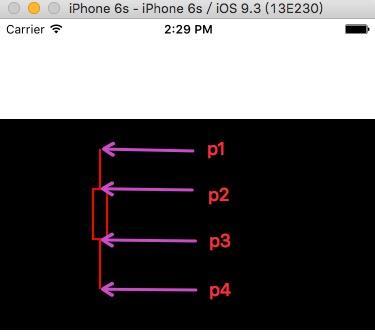
首选需要看一下K线图解, 了解一下一个K线点所需要的数据:
了解一下一个K线点所需要的数据:
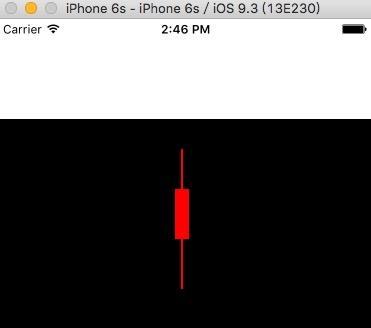
阳线代表股票上涨(收盘价大于开盘价), 阴线则代表股票下跌(收盘价小于开盘价), 由此可以看出画一个K线点需要四个数据, 分别是: 开盘价 - 收盘价 - 最高价 - 最低价, 根据这四个数据画出上影线实体以及下影线, 柱状图(成交量)先不考虑, K线图画出来之后, 成交量柱状图就不在话下了;
下边是实现代码:
- (void)drawRect:(CGRect)rect {
  [super drawRect:rect];

CGPoint p1 = CGPointMake(100, 30);
CGPoint p2 = CGPointMake(100, 70);
CGPoint p3 = CGPointMake(100, 120);
CGPoint p4 = CGPointMake(100, 170);

CGContextRef context = UIGraphicsGetCurrentContext();
CGContextSetStrokeColorWithColor(context, [UIColor redColor].CGColor);
CGContextSetLineWidth(context, 2.0);
// p1 -> p2线段
CGContextMoveToPoint(context, p1.x, p1.y);
CGContextAddLineToPoint(context, p2.x, p2.y);
// p3 -> p4线段
CGContextMoveToPoint(context, p3.x, p3.y);
CGContextAddLineToPoint(context, p4.x, p4.y);
CGContextStrokePath(context);
// 中间实体边框
CGContextStrokeRect(context, CGRectMake(100 - 14 / 2.0, p2.y, 14, p3.y - p2.y));
}
实现代码:
- (void)drawRect:(CGRect)rect {
[super drawRect:rect];

CGPoint p1 = CGPointMake(185, 30);
CGPoint p2 = CGPointMake(185, 70);
CGPoint p3 = CGPointMake(185, 120);
CGPoint p4 = CGPointMake(185, 170);

CGContextRef context = UIGraphicsGetCurrentContext();
CGContextSetStrokeColorWithColor(context, [UIColor redColor].CGColor);
CGContextSetLineWidth(context, 2.0);
// p1 -> p4
CGContextMoveToPoint(context, p1.x, p1.y);
CGContextAddLineToPoint(context, p4.x, p4.y);
CGContextStrokePath(context);
// 画实心实体
CGContextSetFillColorWithColor(context, [UIColor redColor].CGColor);
CGContextFillRect(context, CGRectMake(p1.x - 14 / 2.0, p2.y, 14, p3.y - p2.y));
 }
如果你会画上面两种图,那么K线图就很简单了。
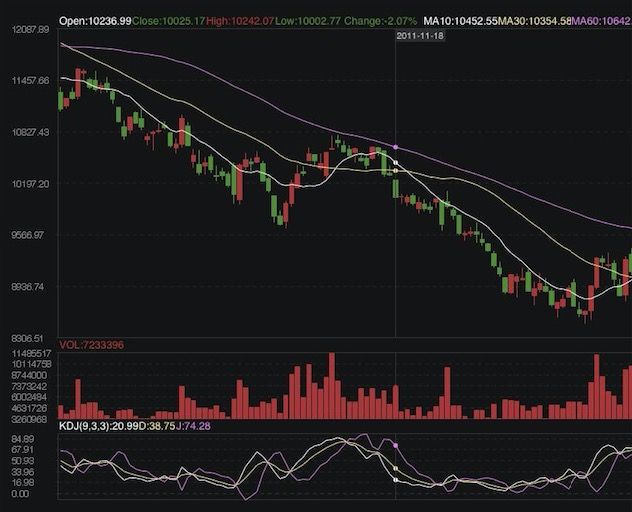
将画K线的代码封装成一个方法,然后将最高价最低价开盘价收盘价等转换成坐标,通过传入四个参数就可以将K线点画出来,然后循环调用该方法就好,至于均线就是一个点一个点连接起来的,同样可以通过线段画出来,这里就不多说了,还有一个十字线,这个只要会画线段就会画十字线,这个也不多说了;
这些掌握了之后就可以绘制专属自己的K线图了,其他的都是一些细节小问题,CGContextRef还有很多用法,有兴趣的自己可以找度娘,接下来附上我的最终的绘制结果:
关于K线图可以左右滑动以及放大缩小,而是当手指滑动或者啮合的时候调用了- (void)drawRect:(CGRect)rect方法,而是又重新画上去了,因为调用比较频繁,所以看起来像是在滑动一样!,所以可以通过手势来实现捏合的展开合并效果。
 /**
  *  处理捏合手势
   *
   *  @param recognizer 捏合手势识别器对象实例
   */
 - (void)handlePinch:(UIPinchGestureRecognizer *)recognizer {
    CGFloat scale = recognizer.scale;
    recognizer.view.transform = CGAffineTransformScale(recognizer.view.transform, scale, scale); //在已缩放大小基础下进行累加变化;区别于:使用 CGAffineTransformMakeScale 方法就是在原大小基础下进行变化
    recognizer.scale = 1.0;
 }
股票K线图github多星开源项目
Y_KLine
chartee
文中动画曲线图特效细节参看 WYChart
