时间序列简介
时间序列 是指将同一统计指标的数值按其先后发生的时间顺序排列而成的数列。时间序列分析的主要目的是根据已有的历史数据对未来进行预测。
常用的时间序列模型
常用的时间序列模型有四种:自回归模型 AR(p)、移动平均模型 MA(q)、自回归移动平均模型 ARMA(p,q)、自回归差分移动平均模型 ARIMA(p,d,q), 可以说前三种都是 ARIMA(p,d,q)模型的特殊形式。模型的具体方程可以查找相关的专业书籍及网上的资料。
AIRIMA模型的建立与预测
ARIMA 模型是在平稳的时间序列基础上建立起来的,因此时间序列的平稳性是建模的重要前提。检验时间序列模型平稳的方法一般采用 ADF 单位根检验模型去检验。当然如果时间序列不稳定,也可以通过一些操作去使得时间序列稳定(比如取对数,差分),然后进行 ARIMA 模型预测,得到稳定的时间序列的预测结果,然后对预测结果进行之前使序列稳定的操作的逆操作(取指数,差分的逆操作),就可以得到原始数据的预测结果。
ARIMA 模型实践
模型具体的理论知识就不再做过多说明了,来个实际的例子吧。
ARIMA 模型对湖北省 GDP 的实证分析及预测
这里的例子是采用了一篇论文的数据,【ARIMA模型在湖北省GDP预测中的应用】,可以去中国知网搜索篇名进行下载。
年份GDP
1978151.00
1979188.46
1980199.38
......
201324668.49
数据的平稳性处理及检验
这里我们用 Python 对数据进行分析处理建模。
画出原始数据的时间路径图
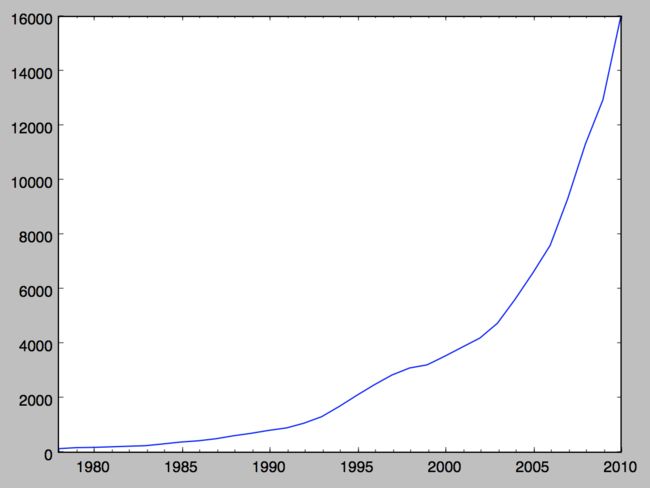
#-*- coding:utf-8 -*-importpandasaspdimportnumpyasnpimportmatplotlib.pyplotaspltimportstatsmodels.apiassmfromstatsmodels.graphics.tsaplotsimportacf,pacf,plot_acf,plot_pacffromstatsmodels.tsa.arima_modelimportARMAtime_series = pd.Series([151.0,188.46,199.38,219.75,241.55,262.58,328.22,396.26,442.04,517.77,626.52,717.08,824.38,913.38,1088.39,1325.83,1700.92,2109.38,2499.77,2856.47,3114.02,3229.29,3545.39,3880.53,4212.82,4757.45,5633.24,6590.19,7617.47,9333.4,11328.92,12961.1,15967.61])time_series.index = pd.Index(sm.tsa.datetools.dates_from_range('1978','2010'))time_series.plot(figsize=(12,8))plt.show()
原始数据.png
由上图我们可以看出,这个时间序列是呈指数形式的,波动性比较大,不是稳定的时间序列,一般对于这种指数形式的数据,可以对其取对数,将其转化为线性趋势。
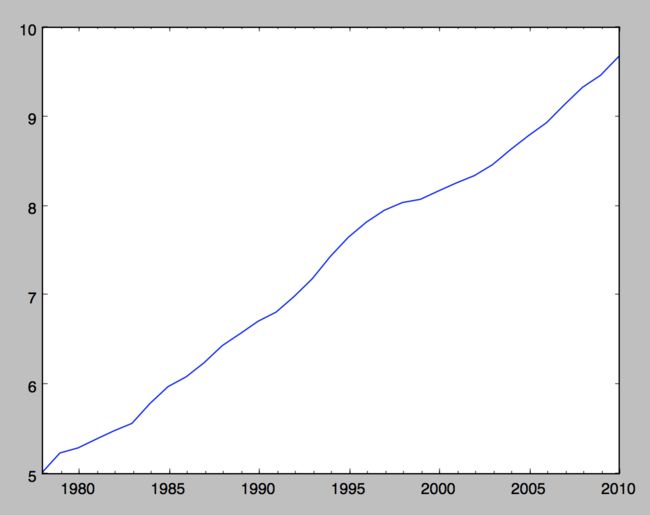
time_series = np.log(time_series)time_series.plot(figsize=(8,6))plt.show()
对原始数据取对数.png
由上图可以看出,去了对数之后的时间路径图明显具有线性趋势,为了确定其稳定性,对取对数后的数据进行 adf 检验
t=sm.tsa.stattools.adfuller(time_series, )output=pd.DataFrame(index=['Test Statistic Value',"p-value","Lags Used","Number of Observations Used","Critical Value(1%)","Critical Value(5%)","Critical Value(10%)"],columns=['value'])output['value']['Test Statistic Value'] = t[0]output['value']['p-value'] = t[1]output['value']['Lags Used'] = t[2]output['value']['Number of Observations Used'] = t[3]output['value']['Critical Value(1%)'] = t[4]['1%']output['value']['Critical Value(5%)'] = t[4]['5%']output['value']['Critical Value(10%)'] = t[4]['10%']print(output)
检验结果如下
检验项检验结果
Test Statistic Value0.807369
p-value0.991754
Lags Used1
Number of Observations Used31
Critical Value(1%)-3.66143
Critical Value(5%)-2.96053
Critical Value(10%)-2.61932
由上表可知,t 统计量要大于任何置信度的临界值,因此认为该序列是非平稳的,所以再对序列进行差分处理,发现差分之后的序列基本达到稳定,如下图所示,并且通过了 ADF 检验,检验结果见下表。
time_series = time_series.diff(1)time_series = time_series.dropna(how=any)time_series.plot(figsize=(8,6))plt.show()t=sm.tsa.stattools.adfuller(time_series)output=pd.DataFrame(index=['Test Statistic Value',"p-value","Lags Used","Number of Observations Used","Critical Value(1%)","Critical Value(5%)","Critical Value(10%)"],columns=['value'])output['value']['Test Statistic Value'] = t[0]output['value']['p-value'] = t[1]output['value']['Lags Used'] = t[2]output['value']['Number of Observations Used'] = t[3]output['value']['Critical Value(1%)'] = t[4]['1%']output['value']['Critical Value(5%)'] = t[4]['5%']output['value']['Critical Value(10%)'] = t[4]['10%']print(output)
差分.png
检验项检验结果
Test Statistic Value-3.52276
p-value0.00742139
Lags Used0
Number of Observations Used31
Critical Value(1%)-3.66143
Critical Value(5%)-2.96053
Critical Value(10%)-2.61932
确定自相关系数和平均移动系数(p,q)
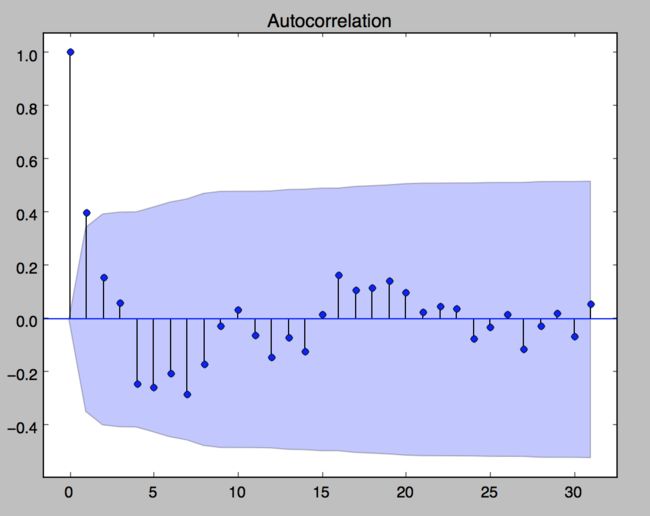
根据时间序列的识别规则,采用 ACF 图、PAC 图,AIC 准则(赤道信息量准则)和 BIC 准则(贝叶斯准则)相结合的方式来确定 ARMA 模型的阶数, 应当选取 AIC 和 BIC 值达到最小的那一组为理想阶数。
plot_acf(time_series)plot_pacf(time_series)plt.show()r,rac,Q = sm.tsa.acf(time_series, qstat=True)prac = pacf(time_series,method='ywmle')table_data = np.c_[range(1,len(r)), r[1:],rac,prac[1:len(rac)+1],Q]table = pd.DataFrame(table_data, columns=['lag',"AC","Q","PAC","Prob(>Q)"])print(table)
偏自相关图.png
自相关图.png
ARIMA.png
根据上面的几个图,我们可以先取 p=1, q=2。进行模型估计,结果见下图。
p,d,q = (1,1,2)arma_mod = ARMA(time_series,(p,d,q)).fit(disp=-1,method='mle')summary = (arma_mod.summary2(alpha=.05, float_format="%.8f"))print(summary)
模型结果.png
这里的 p和q 参数可以调整,然后找出最佳的(AIC最小,BIC最小),经过比较, p=0,q=1 为理想阶数。
这里有一个自动取 p和q 的函数,如果要自动定阶的话,可以采用
(p, q) =(sm.tsa.arma_order_select_ic(dta,max_ar=3,max_ma=3,ic='aic')['aic_min_order'])#这里需要设定自动取阶的 p和q 的最大值,即函数里面的max_ar,和max_ma。ic 参数表示选用的选取标准,这里设置的为aic,当然也可以用bic。然后函数会算出每个 p和q 组合(这里是(0,0)~(3,3)的AIC的值,取其中最小的,这里的结果是(p=0,q=1)。
残差和白噪声检验
个人感觉这个就是对模型 ARIMA(0,1,1) 的残差序列 arma_mod.resid 进行 ADF 检验。
arma_mod = ARMA(time_series,(0,1,1)).fit(disp=-1,method='mle')resid = arma_mod.residt=sm.tsa.stattools.adfuller(resid)output=pd.DataFrame(index=['Test Statistic Value',"p-value","Lags Used","Number of Observations Used","Critical Value(1%)","Critical Value(5%)","Critical Value(10%)"],columns=['value'])output['value']['Test Statistic Value'] = t[0]output['value']['p-value'] = t[1]output['value']['Lags Used'] = t[2]output['value']['Number of Observations Used'] = t[3]output['value']['Critical Value(1%)'] = t[4]['1%']output['value']['Critical Value(5%)'] = t[4]['5%']output['value']['Critical Value(10%)'] = t[4]['10%']print(output)#结果如下Test Statistic Value -3.114p-value 0.025534Lags Used 1Number of Observations Used 30Critical Value(1%) -3.66992Critical Value(5%) -2.96407Critical Value(10%) -2.62117
当然这里也可以画出 acf 图和 pacf 图。
模型预测
arma_model = sm.tsa.ARMA(time_series,(0,1)).fit(disp=-1,maxiter=100)predict_data = arma_model.predict(start=str(1979), end=str(2010+3), dynamic =False)
预测结果.png
预测结果还原
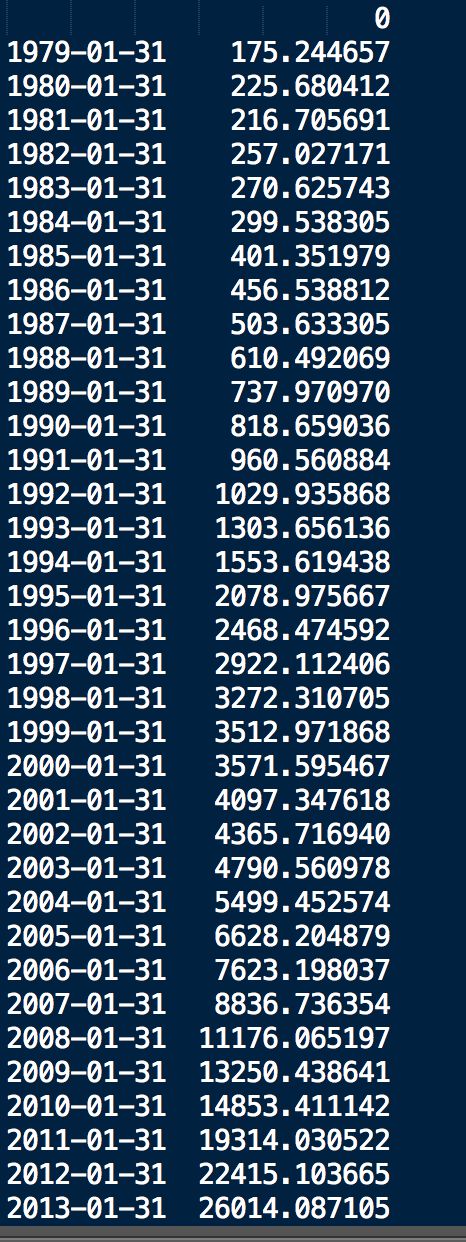
对预测出来的数据,进行逆差分操作(由原始数据取对数后的数据加上预测出来的数据),然后再取指数即可还原。
预测结果还原.png
年份2011年2012年2013年
实际值19632.2622250.4524668.49
预测值19314.0322415.1026014.08
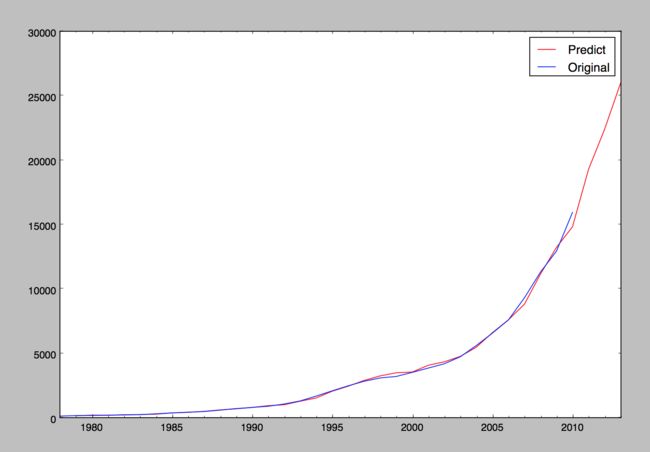
上图最后3个为预测值,然后查询2011年到2013年湖北GDP的实际值,可以进行对照
年份2011年2012年2013年
实际值19632.2622250.4524668.49
预测值19314.0322415.1026014.08
原始数据与预测结果.png
小结
从预测对结果看,2011年到2013年的预测结果和实际的差别不大。这个模型在短期预测结果比较好。模型处理主要还是应用了Python 第三方库 statsmodels 中的模型算法,其中还有很多细节,可以查阅相关文档,这里只是简单的应用了一下,由于代码都是一小段一小段写的,很乱,只提供了一些片段供参考。
参考资料
python时间序列分析
时间序列实战(一)
用ARIMA模型做需求预测
python 时间序列分析之ARIMA
ARIMA模型文档
作者:熙淺
链接:https://www.jianshu.com/p/4130bac8ebec
來源:
著作权归作者所有,任何形式的转载都请联系作者获得授权并注明出处。
