caffe finetune predict and classify the lung nodule( 肺结节的分类)
引言--做了什么?
通过对caffe已有模型进行finetune 实现医学图像CT肺 结节的预测与检测,并实现可视化!
思路--出发点是?
如果将CNN应用于医学图像,首要面对的问题是训练数据的缺乏。因为CNN的训练数据都需要有类别标号,这通常需要专家来手工标记。要是标记像ImageNet这样大规模的上百万张的训练图像,简直是不可想象的。
对于医学图像而言,得到大规模的训练数据是比较不容易的,那么可否使用finetune利用现成的ImageNet的图像来帮助医学图像的识别呢?ImageNet里面的图像(二维,彩色)没有医学图像,包含一些诸如鸟类、猫、狗、直升机等物体的识别,与医学图像(二维或三维,非彩色)相差很大。如果回答是肯定的话,是一件令人非常振奋的事情。
方案--怎么做?
首先是医学图像彩色化:http://blog.csdn.net/dcxhun3/article/details/51777794 其实这也是得到大师的指点的
然后是对样本的data augmentation,方可获得较多样本
再就是对彩色化的图像进行finetune训练
预测
利用finetune后的模型进行结节预测与检测。
caffe预测、特征可视化python接口调用
http://nbviewer.jupyter.org/url/www.openu.ac.il/home/hassner/projects/cnn_agegender/cnn_age_gender_demo.ipynb
代码和结果
借助 jupyter 也就是ipython notebook 现在还不知道怎么将imagenet_classify.ipynb源码上传 等学会了上传。你可以在相应路径下输入ipython notebook 启动 然后逐一将下面的路径复制运行
import os
import numpy as np
import matplotlib.pyplot as plt
%matplotlib inline

#设置caffe源码所在的路径
caffe_root = '/usr/local/caffe/'
import sys
sys.path.insert(0, caffe_root + 'python')
import caffe

plt.rcParams['figure.figsize'] = (10, 10)
plt.rcParams['image.interpolation'] = 'nearest'
plt.rcParams['image.cmap'] = 'gray'

#加载均值文件
mean_filename='./imagenet_mean.binaryproto'
proto_data = open(mean_filename, "rb").read()
a = caffe.io.caffe_pb2.BlobProto.FromString(proto_data)
mean  = caffe.io.blobproto_to_array(a)[0]

#创建网络,并加载已经训练好的模型文件
nodule_net_pretrained='./mytask_train_iter_8000.caffemodel'
nodule_net_model_file='./deploy.prototxt'
nodule_net = caffe.Classifier(nodule_net_model_file, nodule_net_pretrained,
                       mean=mean,
                       channel_swap=(2,1,0),#RGB通道与BGR
                       raw_scale=255,#把图片归一化到0~1之间
                       image_dims=(256, 256))#设置输入图片的大小
(10, 3, 227, 227)
#预测分类及其可特征视化
nodule_list=['bg','nodule'] #类别表
example_image = './2.bmp'
input_image = caffe.io.load_image(example_image)#读取图片
_ = plt.imshow(input_image)#显示原图片

#预测结果
prediction = nodule_net.predict([input_image])
print 'predict bg or nodule:', nodule_list[prediction[0].argmax()]
predict bg or nodule: bg
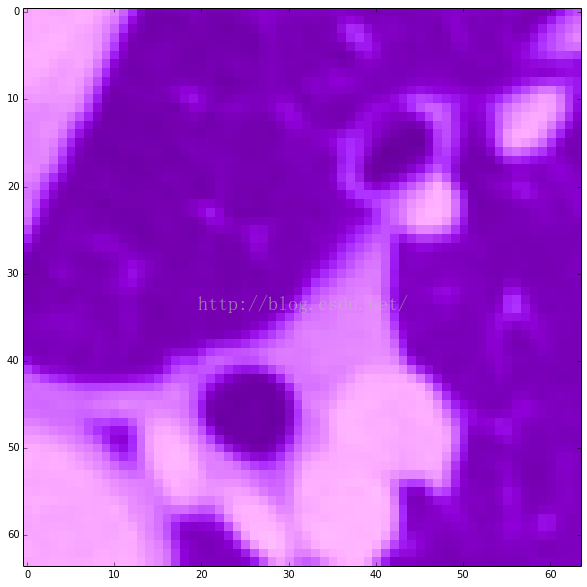
#预测分类及其可特征视化
nodule_list=['bg','nodule'] #类别表
example_image = './136.bmp'
input_image = caffe.io.load_image(example_image)#读取图片
_ = plt.imshow(input_image)#显示原图片

#预测结果
prediction = nodule_net.predict([input_image])
print 'predict bg or nodule:', nodule_list[prediction[0].argmax()]
predict bg or nodule: nodule
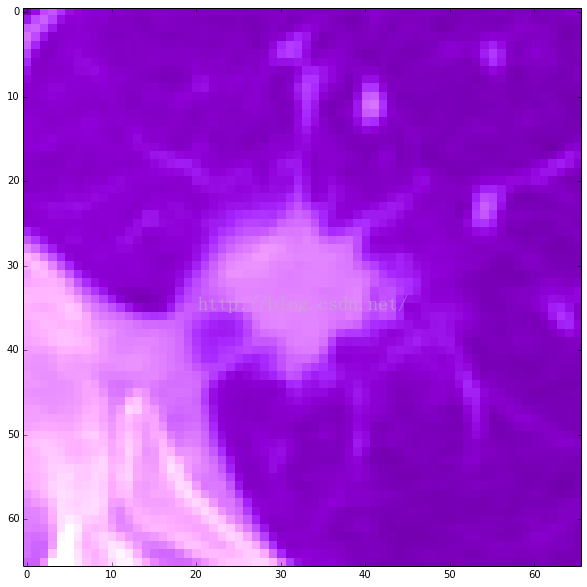
def showimage(im):
    if im.ndim == 3:
        im = im[:, :, ::-1]
    plt.set_cmap('jet')
    plt.imshow(im)


def vis_square(data, padsize=1, padval=0):
    data -= data.min()
    data /= data.max()

    # force the number of filters to be square
    n = int(np.ceil(np.sqrt(data.shape[0])))
    padding = ((0, n ** 2 - data.shape[0]), (0, padsize), (0, padsize)) + ((0, 0),) * (data.ndim - 3)
    data = np.pad(data, padding, mode='constant', constant_values=(padval, padval))

    # tile the filters into an image
    data = data.reshape((n, n) + data.shape[1:]).transpose((0, 2, 1, 3) + tuple(range(4, data.ndim + 1)))
    data = data.reshape((n * data.shape[1], n * data.shape[3]) + data.shape[4:])

    showimage(data)
age_net = caffe.Classifier(nodule_net_model_file, nodule_net_pretrained,
                       channel_swap=(2,1,0),
                       raw_scale=255,
                       image_dims=(256, 256))

prediction = nodule_net.predict([input_image])
_ = plt.imshow(input_image)
filters = nodule_net.params['conv1'][0].data[:49] #conv1滤波器可视化
vis_square(filters.transpose(0, 2, 3, 1))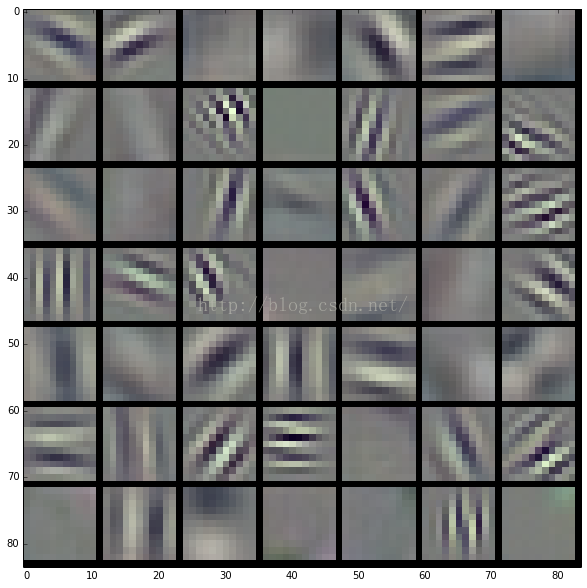
feat = nodule_net.blobs['conv1'].data[4, :49]  #The first Conv layer output, conv1 (rectified responses of the filters above)
vis_square(feat, padval=1)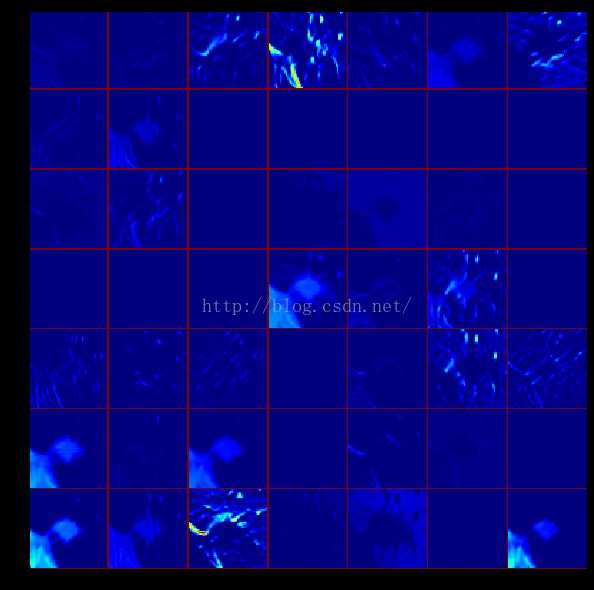
哇塞,可视化成功~不得不佩服Python的强大