(三)使用TensorFlow对一元二次函数进行预测
1、导入所需的库
import tensorflow as tf
import numpy as np
import matplotlib.pyplot as plt
pyplot库是用来绘制数据点与预测的一元二次曲线的拟合关系
2、数据的准备
x_data = np.linspace(-0.5, 0.5, 200)[:, np.newaxis]
noise = np.random.normal(1, 0.01, x_data.shape)
y_data = np.square(x_data) + noise
假设x_data是数据中的自变量,y_data是因变量。
第一行:为方便后续绘制图形,在调用
np.linspace(-0.5, 0.5, 200)[:, np.newaxis]
使得x_data的值为:-0.5到0.5的范围内均匀取值的200个点,并增加x_data的维度,使得x_data的shape为[200,1]。根据本人的理解,这里调整维度的原因可能是因为后续我们在传入x_data的时候是每次传一个值,但是传的次数不定,所以shape应该为[None,1],所以需要增加一个维度(如理解错误,欢迎留言斧正)。
第二行:创建一个以1为指定值,方差为0.01并且shape与x_data相同的noise变量。为什么创建这个变量呢,因为我们想模拟一堆大概符合y=x^2+0.01的数据,让程序通过学习这些数据,画出一条线来拟合这些数据。
3、创建placeholder
x_p = tf.placeholder(tf.float32, shape=[None, 1])创建一个个数未知,但每次只传一个的placeholder
4、隐藏层
l_one_w = tf.Variable(tf.random_normal(shape=[1, 10]))
l_one_b = tf.Variable(tf.zeros(shape=[1, 10]))
l1 = tf.nn.tanh(tf.matmul(x_p, l_one_w) + l_one_b)
第一行:创建一个随机权重变量l_one_w,shape为[1,10],并且符合标准正态分布。shape为[1,10]的原因是在生成预测值的时候,x_p会与l_one_w进行相乘,两矩阵相乘的充要条件是第一个矩阵的列数与第二个矩阵的行数相等,所以l_one_w的行数为1,列数可以随意指定,也可以指定为20.
第二行:创建一个随机偏秩变量l_one_b,shape为[1,10],值都为0。shape为[1,10]的原因是每次输入数据的shape为1x1,l_one_w的shape为1x10,所以相乘的结果的shape为1x10,故l_one_b的shape为[1,10]
第三行:将输入矩阵与权重矩阵相乘再加上偏秩矩阵,将tanh激活函数作用于结果,使结果非线性化
5、输出层
l_two_w = tf.Variable(tf.random_normal(shape=[10, 1]))
l_two_b = tf.Variable(tf.zeros(shape=[1, 1]))
prediction = tf.matmul(l1, l_two_w) + l_two_b
6、求出均方差cost值、选取优化器并初始化变量
loss = tf.reduce_mean(tf.square(y_data - prediction))
train_step = tf.train.GradientDescentOptimizer(0.15).minimize(loss)
init = tf.global_variables_initializer()
7、迭代训练并在训练结束后绘制拟合的曲线
with tf.Session() as sess:
    sess.run(init)
    for step in range(2001):
        sess.run(train_step, feed_dict={x_p: x_data})
    prediction = sess.run(prediction, feed_dict={x_p: x_data})
    plt.figure()
    plt.scatter(x_data, y_data)
    plt.plot(x_data, prediction, 'r-', lw=5)
    plt.show()
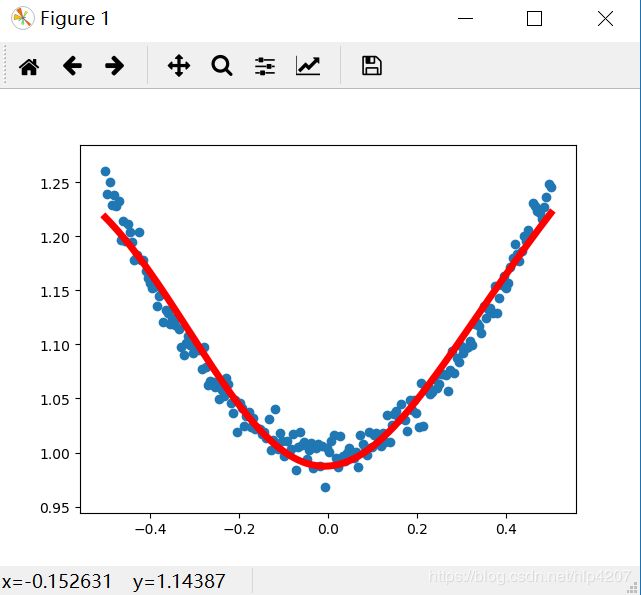
8、运行结果
可以看到拟合的还是不错的,下面贴出完整代码
# -*- coding: UTF-8 -*-


import tensorflow as tf
import numpy as np
import matplotlib.pyplot as plt

x_data = np.linspace(-0.5, 0.5, 200)[:, np.newaxis]
noise = np.random.normal(1, 0.01, x_data.shape)
y_data = np.square(x_data) + noise

x_p = tf.placeholder(tf.float32, shape=[None, 1])
# 第一层隐藏层
# 因为输入数据x与weights相乘后为1*10的向量,所以biases的shape为1*10
l_one_w = tf.Variable(tf.random_normal(shape=[1, 10]))
l_one_b = tf.Variable(tf.zeros(shape=[1, 10]))
l1 = tf.nn.tanh(tf.matmul(x_p, l_one_w) + l_one_b)
# 输出层
# 因为输入数据x与weights相乘后为1*1的向量,所以biases的shape为1*1
l_two_w = tf.Variable(tf.random_normal(shape=[10, 1]))
l_two_b = tf.Variable(tf.zeros(shape=[1, 1]))
prediction = tf.matmul(l1, l_two_w) + l_two_b

loss = tf.reduce_mean(tf.square(y_data - prediction))
train_step = tf.train.GradientDescentOptimizer(0.15).minimize(loss)
init = tf.global_variables_initializer()

with tf.Session() as sess:
    sess.run(init)
    for step in range(2001):
        sess.run(train_step, feed_dict={x_p: x_data})
    prediction = sess.run(prediction, feed_dict={x_p: x_data})
    plt.figure()
    plt.scatter(x_data, y_data)
    plt.plot(x_data, prediction, 'r-', lw=5)
    plt.show()
有不足之处欢迎提问
