实战五:手把手教你用TensorFlow进行房价预测
实战TensorFlow房价预测
github地址
目录
房价预测模型介绍
使用TensorFlow实现房价预测模型
使用TensorBoard可视化模型数据流图
一、房价预测模型介绍
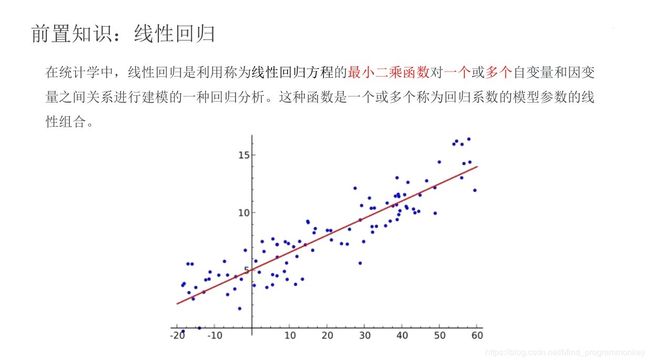
1.前置知识
2.单变量房价预测问题
问题描述:
根据房屋面积x来预测其销售价格y
# 导包
# pandas是一个BSD开源协议许可的,面向python用户的高性能和易于上手的数据结构化和数据分析工具
# seaborn是一个基于matplotlib的python数据可视化库,它提供了更易用的高级接口,而且有易于绘制精美且信息丰富的统计图像
import pandas as pd
import seaborn as sns
sns.set(context="notebook",style="whitegrid",palette="dark")
# 查看q前5行数据
df0 = pd.read_csv("data/data0.csv",names=["square","price"])
df0.head()
| square | price | |
|---|---|---|
| 0 | 2104 | 399900 |
| 1 | 1600 | 329900 |
| 2 | 2400 | 369000 |
| 3 | 1416 | 232000 |
| 4 | 3000 | 539900 |
# 绘图来表示数据
# seaborn.lmplot()方法专门用于用于线性关系的可视化,适用于回归模型
sns.lmplot("square","price",df0,height=6,fit_reg=True)
# 查看数据的详细信息
df0.info()
RangeIndex: 47 entries, 0 to 46
Data columns (total 2 columns):
square    47 non-null int64
price     47 non-null int64
dtypes: int64(2)
memory usage: 832.0 bytes
3. 多变量房价预测
a.问题描述:
根据房屋面积x1和卧室面积数量x2,预测其销售价格y
b.查看数据
# 导包
# matplotlib是一个Python 2D绘图库
# mpl_toolkits.mplot3d是一个基础3d绘图(散点图、平面图、折线图)工具集,也是matplotlib库的一部分
import matplotlib.pyplot as plt

from mpl_toolkits import mplot3d
# 读取数据,显示前5行数据
df1 = pd.read_csv("data/data1.csv",names=["square","bedrooms","price"])
df1.head()
| square | bedrooms | price | |
|---|---|---|---|
| 0 | 2104 | 3 | 399900 |
| 1 | 1600 | 3 | 329900 |
| 2 | 2400 | 3 | 369000 |
| 3 | 1416 | 2 | 232000 |
| 4 | 3000 | 4 | 539900 |
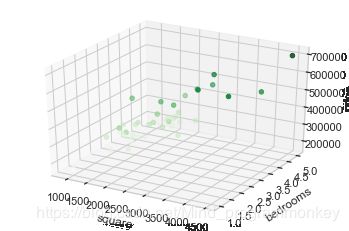
# 绘制3D散点图
fig = plt.figure()
# 创建一个Axes3D object
ax = plt.axes(projection="3d")
# 设置三个坐标的名称
ax.set_xlabel("square")
ax.set_ylabel("bedrooms")
ax.set_zlabel("price")
# 绘制3D散点图
ax.scatter3D(df1["square"],df1["bedrooms"],df1["price"],c=df1["price"],cmap="Greens")
c.数据归一化处理
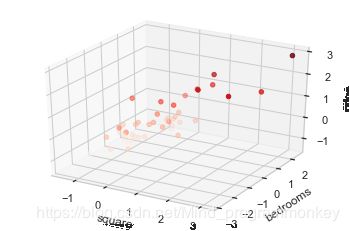
然而房屋面积和卧室数量这两个变量(特征)在数值上差了1000倍。在这种情况下,通常先进行特征缩放,再开始训练,可以加速模型收敛。
# 定义归一化函数
def normalize_feature(df):
    return df.apply(lambda column:(column-column.mean()) / column.std())
# 重新查看数据
df = normalize_feature(df1)
df.head()
| square | bedrooms | price | |
|---|---|---|---|
| 0 | 0.130010 | -0.223675 | 0.475747 |
| 1 | -0.504190 | -0.223675 | -0.084074 |
| 2 | 0.502476 | -0.223675 | 0.228626 |
| 3 | -0.735723 | -1.537767 | -0.867025 |
| 4 | 1.257476 | 1.090417 | 1.595389 |
# 重新展示数据
ax = plt.axes(projection="3d")
ax.set_xlabel("square")
ax.set_ylabel("bedrooms")
ax.set_zlabel("price")
ax.scatter3D(df["square"],df["bedrooms"],df["price"],c=df["price"],cmap="Reds")
# 查看数据详细信息
df.info()
RangeIndex: 47 entries, 0 to 46
Data columns (total 3 columns):
square      47 non-null float64
bedrooms    47 non-null float64
price       47 non-null float64
dtypes: float64(3)
memory usage: 1.2 KB
d.数据处理:添加ones列(x0)
# numpy 是bsd开源协议许可的,面向python用户的基础科学计算库,在多维数组上实现了线性代数、傅里叶变换和其它丰富的函数运算
# 生成一列ones,ones是n行1列的数据框,表示x0恒为1
import numpy as np
ones = pd.DataFrame({"ones":np.ones(len(df))})
# 根据列合并数据
df = pd.concat([ones,df],axis=1)
df.head()
| ones | square | bedrooms | price | |
|---|---|---|---|---|
| 0 | 1.0 | 0.130010 | -0.223675 | 0.475747 |
| 1 | 1.0 | -0.504190 | -0.223675 | -0.084074 |
| 2 | 1.0 | 0.502476 | -0.223675 | 0.228626 |
| 3 | 1.0 | -0.735723 | -1.537767 | -0.867025 |
| 4 | 1.0 | 1.257476 | 1.090417 | 1.595389 |
# 查看详细数据
df.info()
RangeIndex: 47 entries, 0 to 46
Data columns (total 4 columns):
ones        47 non-null float64
square      47 non-null float64
bedrooms    47 non-null float64
price       47 non-null float64
dtypes: float64(4)
memory usage: 1.5 KB
二、使用TensorFlow实现房价预测模型
1.前期数据处理
import pandas as pd
import numpy as np

# 定义标准化的函数
def normalize_feature(df):
    return df.apply(lambda column:(column-column.mean())/column.std())

df = normalize_feature(pd.read_csv("./data/data1.csv",names=["square","bedrooms","price"]))
ones = pd.DataFrame({"ones": np.ones(len(df))})

df = pd.concat([ones,df],axis=1)
df.head()
| ones | square | bedrooms | price | |
|---|---|---|---|---|
| 0 | 1.0 | 0.130010 | -0.223675 | 0.475747 |
| 1 | 1.0 | -0.504190 | -0.223675 | -0.084074 |
| 2 | 1.0 | 0.502476 | -0.223675 | 0.228626 |
| 3 | 1.0 | -0.735723 | -1.537767 | -0.867025 |
| 4 | 1.0 | 1.257476 | 1.090417 | 1.595389 |
2.获取数据
X_data = np.array(df[df.columns[0:3]])
y_data = np.array(df[df.columns[-1]]).reshape(len(df),1)

print(X_data.shape,type(X_data))
print(y_data.shape,type(y_data))
(47, 3)
(47, 1)
3.创建线性回归模型
import tensorflow as tf

alpha = 0.01 # 学习率 alpha
epoch = 500 # 训练全量数据集的轮数

with tf.name_scope('input'):
    # 输入 X,形状[47, 3]
    X = tf.placeholder(tf.float32, X_data.shape, name='X')
    # 输出 y,形状[47, 1]
    y = tf.placeholder(tf.float32, y_data.shape, name='y')

with tf.name_scope('hypothesis'):
    # 权重变量 W,形状[3,1]
    W = tf.get_variable("weights",
                        (X_data.shape[1], 1),
                        initializer=tf.constant_initializer())
    # 假设函数 h(x) = w0*x0+w1*x1+w2*x2, 其中x0恒为1
    # 推理值 y_pred  形状[47,1]
    y_pred = tf.matmul(X, W, name='y_pred')

with tf.name_scope('loss'):
    # 损失函数采用最小二乘法,y_pred - y 是形如[47, 1]的向量。
    # tf.matmul(a,b,transpose_a=True) 表示:矩阵a的转置乘矩阵b,即 [1,47] X [47,1]
    # 损失函数操作 loss
    loss_op = 1 / (2 * len(X_data)) * tf.matmul((y_pred - y), (y_pred - y), transpose_a=True)
with tf.name_scope('train'):
    # 随机梯度下降优化器 opt
    train_op = tf.train.GradientDescentOptimizer(learning_rate=alpha).minimize(loss_op)
WARNING:tensorflow:From D:\software\Anaconda\workplace\lib\site-packages\tensorflow\python\framework\op_def_library.py:263: colocate_with (from tensorflow.python.framework.ops) is deprecated and will be removed in a future version.
Instructions for updating:
Colocations handled automatically by placer.
4.创建会话
with tf.Session() as sess:
    # 初始化全局变量
    sess.run(tf.global_variables_initializer())
    # 创建FileWriter实例,并传入当前会话加载的数据流图
    writer = tf.summary.FileWriter('./summary/linear-regression-1', sess.graph)
    # 记录所有损失值
    loss_data = []
    # 开始训练模型
    # 因为训练集较小,所以采用批梯度下降优化算法,每次都使用全量数据训练
    for e in range(1, epoch + 1):
        _, loss, w = sess.run([train_op, loss_op, W], feed_dict={X: X_data, y: y_data})
        # 记录每一轮损失值变化情况
        loss_data.append(float(loss))
        if e % 10 == 0:
            log_str = "Epoch %d \t Loss=%.4g \t Model: y = %.4gx1 + %.4gx2 + %.4g"
            print(log_str % (e, loss, w[1], w[2], w[0]))

# 关闭FileWriter的输出流
writer.close()
Epoch 10 	 Loss=0.4184 	 Model: y = 0.0791x1 + 0.03948x2 + 3.353e-10
Epoch 20 	 Loss=0.3582 	 Model: y = 0.1489x1 + 0.07135x2 + -5.588e-11
Epoch 30 	 Loss=0.3126 	 Model: y = 0.2107x1 + 0.09676x2 + 3.912e-10
Epoch 40 	 Loss=0.2778 	 Model: y = 0.2655x1 + 0.1167x2 + -1.863e-11
Epoch 50 	 Loss=0.2512 	 Model: y = 0.3142x1 + 0.1321x2 + 1.77e-10
Epoch 60 	 Loss=0.2306 	 Model: y = 0.3576x1 + 0.1436x2 + -4.47e-10
Epoch 70 	 Loss=0.2145 	 Model: y = 0.3965x1 + 0.1519x2 + -8.941e-10
Epoch 80 	 Loss=0.2018 	 Model: y = 0.4313x1 + 0.1574x2 + -6.24e-10
Epoch 90 	 Loss=0.1917 	 Model: y = 0.4626x1 + 0.1607x2 + -4.191e-10
Epoch 100 	 Loss=0.1835 	 Model: y = 0.4909x1 + 0.1621x2 + -5.402e-10
Epoch 110 	 Loss=0.1769 	 Model: y = 0.5165x1 + 0.162x2 + -7.125e-10
Epoch 120 	 Loss=0.1714 	 Model: y = 0.5397x1 + 0.1606x2 + -5.076e-10
Epoch 130 	 Loss=0.1668 	 Model: y = 0.5609x1 + 0.1581x2 + -8.335e-10
Epoch 140 	 Loss=0.1629 	 Model: y = 0.5802x1 + 0.1549x2 + -9.22e-10
Epoch 150 	 Loss=0.1596 	 Model: y = 0.5979x1 + 0.1509x2 + -9.011e-10
Epoch 160 	 Loss=0.1567 	 Model: y = 0.6142x1 + 0.1465x2 + -3.399e-10
Epoch 170 	 Loss=0.1542 	 Model: y = 0.6292x1 + 0.1416x2 + -2.561e-11
Epoch 180 	 Loss=0.152 	 Model: y = 0.643x1 + 0.1364x2 + -2.491e-10
Epoch 190 	 Loss=0.15 	 Model: y = 0.6559x1 + 0.131x2 + 1.164e-11
Epoch 200 	 Loss=0.1483 	 Model: y = 0.6678x1 + 0.1255x2 + 2.654e-10
Epoch 210 	 Loss=0.1467 	 Model: y = 0.6789x1 + 0.1199x2 + 1.979e-10
Epoch 220 	 Loss=0.1453 	 Model: y = 0.6892x1 + 0.1142x2 + 2.34e-10
Epoch 230 	 Loss=0.144 	 Model: y = 0.6989x1 + 0.1085x2 + 1.409e-10
Epoch 240 	 Loss=0.1429 	 Model: y = 0.708x1 + 0.1029x2 + 6.252e-10
Epoch 250 	 Loss=0.1419 	 Model: y = 0.7165x1 + 0.09736x2 + 6.834e-10
Epoch 260 	 Loss=0.1409 	 Model: y = 0.7245x1 + 0.09189x2 + 1.127e-09
Epoch 270 	 Loss=0.14 	 Model: y = 0.732x1 + 0.08653x2 + 7.765e-10
Epoch 280 	 Loss=0.1393 	 Model: y = 0.7391x1 + 0.08128x2 + 8.126e-10
Epoch 290 	 Loss=0.1385 	 Model: y = 0.7458x1 + 0.07616x2 + 5.047e-10
Epoch 300 	 Loss=0.1379 	 Model: y = 0.7522x1 + 0.07118x2 + 9.93e-10
Epoch 310 	 Loss=0.1373 	 Model: y = 0.7582x1 + 0.06634x2 + 1.224e-09
Epoch 320 	 Loss=0.1367 	 Model: y = 0.7639x1 + 0.06165x2 + 1.169e-09
Epoch 330 	 Loss=0.1362 	 Model: y = 0.7693x1 + 0.0571x2 + 1.327e-09
Epoch 340 	 Loss=0.1358 	 Model: y = 0.7744x1 + 0.0527x2 + 1.409e-09
Epoch 350 	 Loss=0.1353 	 Model: y = 0.7793x1 + 0.04845x2 + 1.588e-09
Epoch 360 	 Loss=0.135 	 Model: y = 0.784x1 + 0.04435x2 + 1.63e-09
Epoch 370 	 Loss=0.1346 	 Model: y = 0.7884x1 + 0.0404x2 + 2.116e-09
Epoch 380 	 Loss=0.1343 	 Model: y = 0.7926x1 + 0.03658x2 + 1.931e-09
Epoch 390 	 Loss=0.134 	 Model: y = 0.7966x1 + 0.03291x2 + 1.914e-09
Epoch 400 	 Loss=0.1337 	 Model: y = 0.8004x1 + 0.02938x2 + 2.179e-09
Epoch 410 	 Loss=0.1335 	 Model: y = 0.8041x1 + 0.02598x2 + 2.181e-09
Epoch 420 	 Loss=0.1332 	 Model: y = 0.8076x1 + 0.02271x2 + 2.497e-09
Epoch 430 	 Loss=0.133 	 Model: y = 0.8109x1 + 0.01957x2 + 2.655e-09
Epoch 440 	 Loss=0.1328 	 Model: y = 0.8141x1 + 0.01655x2 + 3.158e-09
Epoch 450 	 Loss=0.1327 	 Model: y = 0.8171x1 + 0.01366x2 + 3.703e-09
Epoch 460 	 Loss=0.1325 	 Model: y = 0.82x1 + 0.01087x2 + 4.021e-09
Epoch 470 	 Loss=0.1323 	 Model: y = 0.8228x1 + 0.008204x2 + 3.739e-09
Epoch 480 	 Loss=0.1322 	 Model: y = 0.8254x1 + 0.005641x2 + 3.865e-09
Epoch 490 	 Loss=0.1321 	 Model: y = 0.828x1 + 0.003183x2 + 4.31e-09
Epoch 500 	 Loss=0.132 	 Model: y = 0.8304x1 + 0.0008239x2 + 4.303e-09
估计模型:y = 0.8304x1 + 0.0008239x2 + 4.303e-09
三、使用TensorBoard可视化模型数据流图
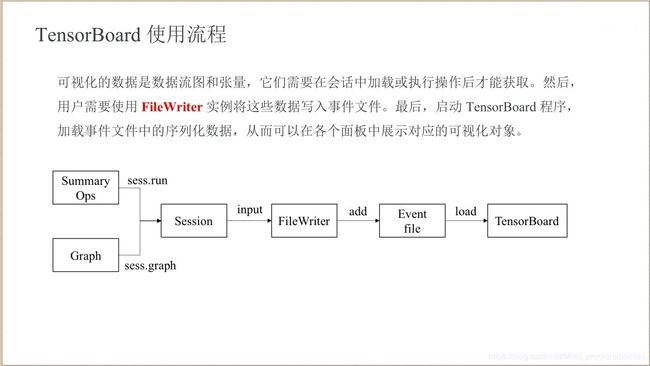
1.TensorBoard使用流程
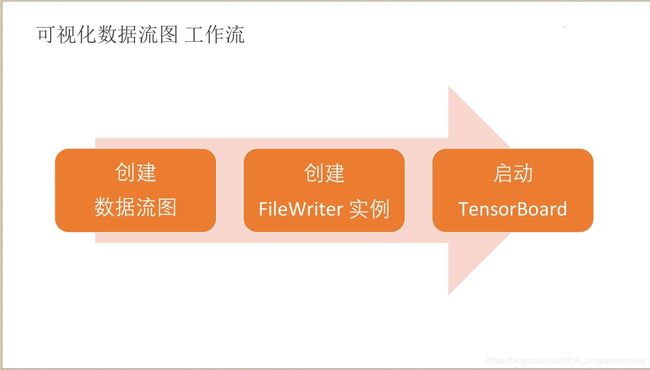
2.可视化数据流图–工作流
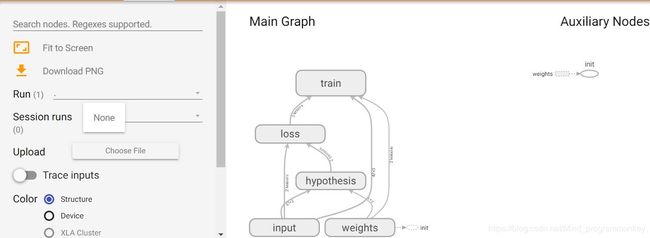
3.可视化数据流图制作
a.TensorBoard查看数据流图
![]()
b.可视化损失值
import matplotlib.pyplot as plt
import seaborn as sns
sns.set(context="notebook", style="whitegrid", palette="dark")

ax = sns.lineplot(x='epoch', y='loss', data=pd.DataFrame({'loss': loss_data, 'epoch': np.arange(epoch)}))
ax.set_xlabel('epoch')
ax.set_ylabel('loss')
plt.show()


