3-2 Python实现支持向量机SVM应用
支持向量机SVM应用
简单示例
# coding=utf-8
from sklearn import svm

# 定义三个点
X = [[2, 0], [1, 1], [2,3]]
# class label 定义点的分类,分别对应上边三个点,且线性可分
y = [0, 0, 1]
# 建立分类器,选用SVC方程,kernel表示核函数(线性)
clf = svm.SVC(kernel = 'linear')
# 进行分类,建立模型
clf.fit(X, y)

print clf

# 打印支持向量
print clf.support_vectors_

# 打印之前传入点属于支持向量的index
print clf.support_

# 打印 每个类有多少点属于支持向量
print clf.n_support_

# 预测

print clf.predict([2, .0])
运行结果
SVC(C=1.0, cache_size=200, class_weight=None, coef0=0.0,
  DeprecationWarning)
  decision_function_shape=None, degree=3, gamma='auto', kernel='linear',
  max_iter=-1, probability=False, random_state=None, shrinking=True,
  tol=0.001, verbose=False)
[[ 1.  1.]
 [ 2.  3.]]
[1 2]
[1 1]
[0]
一个稍微复杂一点的例子
# coding=utf-8
print(__doc__)
import numpy as np
import pylab as pl
from sklearn import svm
# we create 40 separable points
# seed设为0每次运行结果相同
np.random.seed(0)
# 以正太分布生成点
X = np.r_[np.random.randn(20, 2) - [2, 2], np.random.randn(20, 2) + [2, 2]]
# 前二十个是0类,后二十个是1类
Y = [0] * 20 + [1] * 20
# fit the model,构建分类器
clf = svm.SVC(kernel='linear')
# 构建模型
clf.fit(X, Y)
# In scikit-learn coef_ attribute holds the vectors of the separating hyperplanes for linear models. It has shape (n_classes, n_features) if n_classes > 1 (multi-class one-vs-all) and (1, n_features) for binary classification.
#
# In this toy binary classification example, n_features == 2, hence w = coef_[0] is the vector orthogonal to the hyperplane (the hyperplane is fully defined by it + the intercept).
#
# To plot this hyperplane in the 2D case (any hyperplane of a 2D plane is a 1D line), we want to find a f as in y = f(x) = a.x + b. In this case a is the slope of the line and can be computed by a = -w[0] / w[1].
# 得到超平面截距方程
w = clf.coef_[0]
a = -w[0] / w[1]
xx = np.linspace(-5, 5)
yy = a * xx - (clf.intercept_[0]) / w[1]
# plot the parallels to the separating hyperplane that pass through the
# support vectors
b = clf.support_vectors_[0]
yy_down = a * xx + (b[1] - a * b[0])
b = clf.support_vectors_[-1]
yy_up = a * xx + (b[1] - a * b[0])
print "w: ", w
print "a: ", a
# print " xx: ", xx
# print " yy: ", yy
print "support_vectors_: ", clf.support_vectors_
print "clf.coef_: ", clf.coef_
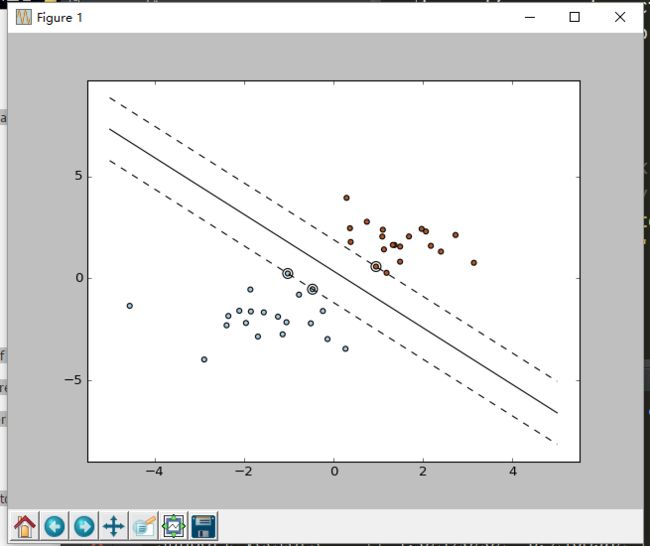
# plot the line, the points, and the nearest vectors to the plane
pl.plot(xx, yy, 'k-')
pl.plot(xx, yy_down, 'k--')
pl.plot(xx, yy_up, 'k--')
pl.scatter(clf.support_vectors_[:, 0], clf.support_vectors_[:, 1],
s=80, facecolors='none')
pl.scatter(X[:, 0], X[:, 1], c=Y, cmap=pl.cm.Paired)
pl.axis('tight')
pl.show()