参考资料
chapter2
Training Machine Learning Algorithms for Classifcation
引言:
在学习过基本的单层感知机模型之后,我们现在来学习了解另一种单层神经网络模型:
ADAptive LInear NEuron (Adaline) 自适应线性神经单元 这种 Adaline 的特别之处在于 它引入了损失函数 cost function
Adaline 与 Perceptron 的根本区别在于它们对权值更新方法的不同
***the weights are updated based on a linear activation function rather than a unit step function ***
Perceptron (感知机):
Adaline (自适应线性) J是损失函数
展开形式如下
......
算法原理
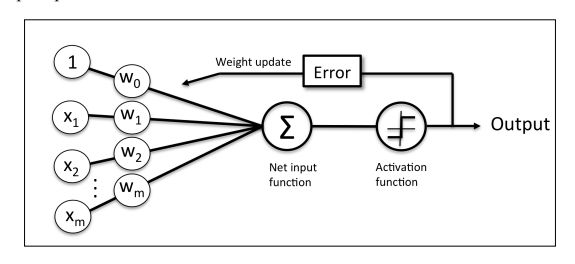
1:算法流程
自适应线性单元 Adaline
感知机 Perceptron
Adaline 比 perceptron 多了一个量化器,用于将激励函数输出的结果进行二分,来判断样本的类别
2: 损失函数
损失函数是用来衡量模拟结果与实际结果差异的一个函数
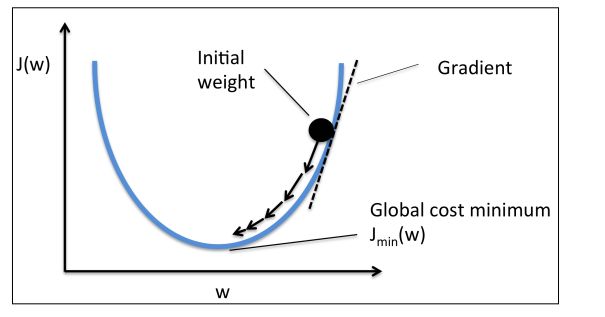
我们的思路是,选择一个方法使得损失函数趋向最小值,那么这也就说明了我们的模型对实际符合的越好,根据这一个原理去更新权值
思路图:
在 Adaline 中,我们选择 SSE 平方差函数作为损失函数
由于 Adaline 采用的线性激励函数 (本次练习采用的是恒同映射) 是一个可微的函数(differentiable), 所以我们可以定义 J 的梯度(偏分)
把这个式子用矩阵表达一下~
再根据这个梯度更新权值
分类根据每一次迭代使用的训练集范围不同,梯度下降算法可以分成三种: 批量梯度下降(BGD),随机梯度下降(SGD),小批量梯度下降(MBGD)
- 批量梯度下降(BGD):损失函数由全部训练集的数据误差构成,当数据量很大的时候,速度会非常慢
- 随机梯度下降(SGD): 每一次更新只考虑一个样本的数据误差,所以速度很快,能进行在线的参数更新
- 小批量梯度下降(MBGD): 每次跟新只考虑小批量的样本数据误差, 是前两种策略的折中方案
Python 实现(BGD)
有了第一节的基础,这个实现起来就比较容易了,我们新建一个Adaline类,这个类与Perceptron 类的区别在于更新权值的方法不同,一样,需要注释的地方都在代码里面了,直接看代码
__author__ = 'Administrator'
#! /usr/bin/python
 # -*- coding:utf8 -*-
import numpy as np
class AdalineGD(object):
    """
    ADAlineGD Linear Neuron classifier.
    Parameters(参数)
    ------------
    eta : float
    Learning rate (between 0.0 and 1.0) 学习效率
    n_iter : int
    Passes over the training dataset(数据集).
    Attributes(属性)
    -----------
    w_ : 1d-array
    Weights after fitting.
    errors_ : list
    Number of misclassifications in every epoch(时间起点).
    """

    def __init__(self, eta=0.01, n_iter=10):
        self.eta = eta
        self.n_iter = n_iter
    def fit(self, X, y):
        '''
    Fit training data.
    Parameters
    ----------
    X : {array-like}, shape = [n_samples, n_features] X的形式是列表的列表
    Training vectors, where n_samples is the number of samples
    and n_features is the number of features.
    y : array-like, shape = [n_samples]
    Target values.
    Returns
    -------
    self : object
'''
        self.w_ = np.zeros(1 + X.shape[1])
        #X.shape = (100,2),zeros 生成的是列向量
        #self.w_ 是一个(3,1)的矩阵
        # print('X.shape[1]=',X.shape[1])
        self.cost_ =[]
        #self.cost_损失函数 cost_function
        # zeros()创建了一个 长度为 1+X.shape[1] = 1+n_features 的 0数组
        # self.w_ 权向量
        self.errors_ = []
        for i in range(self.n_iter):
            output = self.net_input(X)
            '''
            if i==1:
                print(output)
                print(y)
            '''
            # y(100,1) output(100,1),errors(100,1)
            errors = (y - output)

            self.w_[1:] += self.eta * X.T.dot(errors)
            #   X先取转置(2,100),再矩阵乘法乘以 errors(100,1) X.T.dot(errors) (2,1)
            self.w_[0] += self.eta * errors.sum()
            cost = (errors**2).sum()/2
            self.cost_.append(cost)
        # print(self.w_.shape)
        # print(self.w_)
        # print(X.shape)
        return self

    def net_input(self, X):
        """Calculate net input"""
        #np.dot(A,B)表示矩阵乘法 ,X(100,2) self.w_[1:](2,1)
        #注意 这里每一组 向量x = [x1,x2] 不是 [x1,,,,,,x100]!!!
        #所以得到的 net_input 是(100,1)的矩阵 表示100个样本的net_input
        return (np.dot(X, self.w_[1:])+self.w_[0])

    def activation(self,X):
        """Compute linear activation"""

        return self.net_input(X)

    def predict(self, X):
        """return class label after unit step"""
        return np.where(self.net_input(X) >= 0.0, 1, -1)
然后还是用鸢尾花Iris的数据集来测试一下
from GD import AdalineGD
import matplotlib.pyplot as plt
import pandas as pd
import numpy as np
from PDC import plot_decision_regions
filename = 'Iris.csv'
df = pd.read_csv(filename,header=None)
y = df.iloc[0:100, 4].values # .values将dataframe中的值存进一个list中
y = np.where(y=='Iris-setosa',-1,1) #如果是 Iris-setosa y=-1否则就是1 (二元分类)
X = df.iloc[0:100,[0,2]].values

fig, ax = plt.subplots(nrows=1, ncols=2,figsize=(10, 6))
adal = AdalineGD(n_iter=10,eta=0.01).fit(X,y)

ax[0].plot(range(1,len(adal.cost_)+1),
           np.log10(adal.cost_),marker='o')
ax[0].set_xlabel('Epochs')
ax[0].set_ylabel('log(Sum-squared-error)')
ax[0].set_title('Adaline - Learing rate 0.01')
ada2 = AdalineGD(n_iter=10,eta=0.0001).fit(X,y)
ax[1].plot(range(1,len(ada2.cost_)+1),
           np.log10(ada2.cost_),marker='o')
ax[1].set_xlabel('Epochs')
ax[1].set_ylabel('log(Sum-squared-error)')
ax[1].set_title('Adaline - Learing rate 0.0001')
plt.savefig('Compare effect.png')
plt.show()
结果如图
我们可以发现当学习速率过快时,有可能会让误差发散
这是因为
这个时候的学习速率(dw)已经超过了 |Wmin-Winitial|
但是,学习速率过小又会导致收敛速率过慢,于是我们要引入归一化/标准化处理,让各个数据的维度处在一个级别
归一化/标准化处理
常用的归一化处理方法是
减去平均值再除以标准差
#接上面的代码
X_std = np.copy(X)
X_std[:,0] = (X[:,0]-X[:,0].mean())/ X[:,0].std() #.std() 标准差
X_std[:,1] = (X[:,1]-X[:,1].mean())/ X[:,1].std() #.std() 标准差

ada = AdalineGD(n_iter=15, eta=0.01)
ada.fit(X_std,y)
print(ada.predict(X_std))
plot_decision_regions(X_std, y, classifier=ada)
plt.title('Adaline- Dradient Descent')
plt.xlabel('sepal length [standardized]')
plt.ylabel('petal length [standardized]')
plt.legend(loc='upper left')
plt.savefig('Adaline- Dradient Descent.png')
plt.show()
plt.plot(range(1,len(ada.cost_)+1), ada.cost_, marker='o')
plt.xlabel('Epochs')
plt.ylabel('Sum-squared-error')
plt.savefig('Sum-squared-error.png')
plt.show()
看一下结果
刚刚对学习速率是 0.01 发散的,现在收敛了
学习的成果 ~ ~ ~~~
我们像第一节一样换一下训练集然后测试一下
OK!


