Kaggle上的Titanic,先跟着别人做,学习下别人的特征工程和调参。
https://www.kaggle.com/startupsci/titanic-data-science-solutions
这篇是vote最多的一个kernel,就从这里开始吧。
背景是20世纪初泰坦尼克沉没,船上有2214人,约32%的人获救,数据集中给出了船上人员的信息,你需要对这些信息进行整理建模,从而预测他是否会获救。
# data analysis and wrangling
import pandas as pd
import numpy as np
import random as rnd

# visualization
import seaborn as sns
import matplotlib.pyplot as plt
%matplotlib inline

# machine learning
from sklearn.linear_model import LogisticRegression
from sklearn.svm import SVC, LinearSVC
from sklearn.ensemble import RandomForestClassifier
from sklearn.neighbors import KNeighborsClassifier
from sklearn.naive_bayes import GaussianNB
from sklearn.linear_model import Perceptron
from sklearn.linear_model import SGDClassifier
from sklearn.tree import DecisionTreeClassifier
需要用到的包
所需的数据:https://www.kaggle.com/c/titanic/data 大家自己下载
train_df = pd.read_csv('../input/train.csv')
test_df = pd.read_csv('../input/test.csv')
combine = [train_df, test_df]
数据读进来之后让我们看看都有哪些特征呢
print(train_df.columns.values)

['PassengerId' 'Survived' 'Pclass' 'Name' 'Sex' 'Age' 'SibSp' 'Parch'
 'Ticket' 'Fare' 'Cabin' 'Embarked']
看看这些特征哪些是标签型的,哪些是数值型的呢
Categorical: Survived, Sex, and Embarked. Ordinal: Pclass.
注意其中Pclass是有次序的
这些是数值型的,一部分是连续的,剩下是离散值
Continous: Age, Fare. Discrete: SibSp, Parch.
看一下数据吧:
train_df.head()
数据里有哪些是混合型特征呢?
Ticket is a mix of numeric and alphanumeric data types. Cabin is alphanumeric.可以看到Ticket和Cabin都是字母数字混合型,但是Cabin字母是有序的
那么哪些特征包含错误信息呢?
数据集很大的时候我们很难检查,但是这种小数据量下还是可以发现的
比如姓名这一个特征栏:有拼写错误,头衔,缩写等等问题
还有的特征需要修正,里面存在空白值。
Cabin > Age > Embarked features contain a number of null values in that order for the training dataset.
Cabin > Age are incomplete in case of test dataset.
好了,再看一下特征的数据信息:
train_df.info()
print('_'*40)
test_df.info()
RangeIndex: 891 entries, 0 to 890
Data columns (total 12 columns):
PassengerId    891 non-null int64
Survived       891 non-null int64
Pclass         891 non-null int64
Name           891 non-null object
Sex            891 non-null object
Age            714 non-null float64
SibSp          891 non-null int64
Parch          891 non-null int64
Ticket         891 non-null object
Fare           891 non-null float64
Cabin          204 non-null object
Embarked       889 non-null object
dtypes: float64(2), int64(5), object(5)
memory usage: 83.6+ KB
________________________________________

RangeIndex: 418 entries, 0 to 417
Data columns (total 11 columns):
PassengerId    418 non-null int64
Pclass         418 non-null int64
Name           418 non-null object
Sex            418 non-null object
Age            332 non-null float64
SibSp          418 non-null int64
Parch          418 non-null int64
Ticket         418 non-null object
Fare           417 non-null float64
Cabin          91 non-null object
Embarked       418 non-null object
dtypes: float64(2), int64(4), object(5)
memory usage: 36.0+ KB
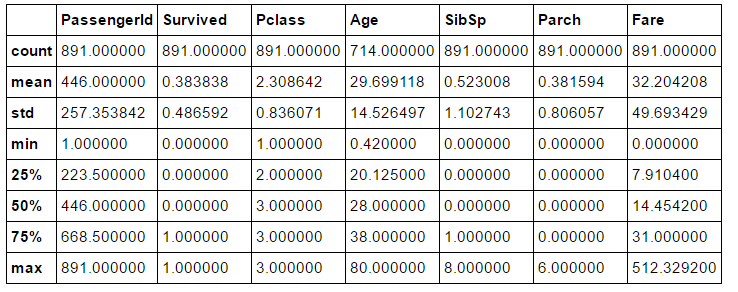
对数据做一些简单的统计分析吧!
Total samples are 891 or 40% of the actual number of passengers on board the Titanic (2,224).(891个样本占总体2224个人的40%)
Survived is a categorical feature with 0 or 1 values.(是否获救用0,1来代表,1为获救)
Around 38% samples survived representative of the actual survival rate at 32%.(样本中获救率为38%,而真实获救率为32%)
Most passengers (> 75%) did not travel with parents or children.(超过75%的人没有和父母孩子旅行)
Nearly 30% of the passengers had siblings and/or spouse aboard.(有30%的人有配偶或兄弟姐妹在船上)
Fares varied significantly with few passengers (<1%) paying as high as $512.(少于1%付了最高可达512美刀的船费)
Few elderly passengers (<1%) within age range 65-80.(65-80岁的旅行者很少,少于1%)
train_df.describe()
Names are unique across the dataset (count=unique=891)(名字都是唯一的!)
Sex variable as two possible values with 65% male (top=male, freq=577/count=891).(性别比)
Cabin values have several dupicates across samples. Alternatively several passengers shared a cabin.(房间号重复率很高,好几个人住一个房间)
Embarked takes three possible values. S port used by most passengers (top=S)(登陆港口有三个,其中S最多)
Ticket feature has high ratio (22%) of duplicate values (unique=681).(船票编号重复率很高,22%)
train_df.describe(include=['O'])
数据分析的假设##
特征相关性分析
看看不同特征和生存率之间的关系
补全数据
1.需要补全年龄这个特征
2.港口信息也要补全
这两个特征和获救率有很大关系
修正特征
票号这个特征重复高,没有实际用途,需要删除
游客编号也要删掉
船舱号可能也要删除
创造新特征
这个后面会写到
分类
妇女,小孩,仓位等级高的人更容易获救
数据分组观察##
现在要依据不同特征类别分组进行观察。
train_df[['Pclass', 'Survived']].groupby(['Pclass'], as_index=False).mean().sort_values(by='Survived', ascending=False)
train_df[["Sex", "Survived"]].groupby(['Sex'], as_index=False).mean().sort_values(by='Survived', ascending=False)
剩下的几个特征大家依样画葫芦试试咯
观察完分组特征后,是时候可视化数据了##
表格毕竟没有图来的清楚明了,可视化数据是关键一环
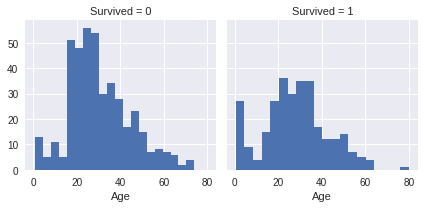
观察到
Infants (Age <=4) had high survival rate.(小于4岁婴儿生存率很高)
Oldest passengers (Age = 80) survived.(80岁老人生存率很高)
Large number of 15-25 year olds did not survive.(15-25岁很多人没有获救)
Most passengers are in 15-35 age range.(大多数人在15-35岁)
结论
We should consider Age (our assumption classifying #2) in our model training.(训练模型的时候得考虑年龄)
Complete the Age feature for null values (completing #1).(补全年龄特征的空值)
We should band age groups (creating #3).(需要对年龄段分组)
g = sns.FacetGrid(train_df, col='Survived')
g.map(plt.hist, 'Age', bins=20)
有次序的特征
Observations.
Pclass=3 had most passengers, however most did not survive. Confirms our classifying assumption #2.(3等座人最多,但多数人都跪了,证实了我们开始的数据假设)
Infant passengers in Pclass=2 and Pclass=3 mostly survived. Further qualifies our classifying assumption #2.(未成年的2、3等座乘客大多获救)
Most passengers in Pclass=1 survived. Confirms our classifying assumption #3.(一等座大多获救)
Pclass varies in terms of Age distribution of passengers.
Decisions.结论
Consider Pclass for model training.(座位等级需要考虑)
# grid = sns.FacetGrid(train_df, col='Pclass', hue='Survived')
grid = sns.FacetGrid(train_df, col='Survived', row='Pclass', size=2.2, aspect=1.6)
grid.map(plt.hist, 'Age', alpha=.5, bins=20)
grid.add_legend();
修正类别属性
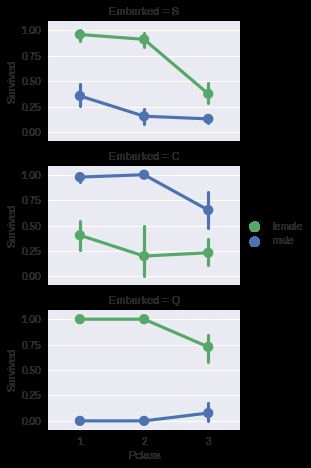
Observations.观察到
Female passengers had much better survival rate than males. Confirms classifying (#1).(女性乘客获救率更高)
Exception in Embarked=C where males had higher survival rate. This could be a correlation between Pclass and Embarked and in turn Pclass and Survived, not necessarily direct correlation between Embarked and Survived.(除了登陆点为C的男性获救率更高之外,其余都是女性获救率更高,座位次序高的获救率高)
Males had better survival rate in Pclass=3 when compared with Pclass=2 for C and Q ports. Completing (#2).
Ports of embarkation have varying survival rates for Pclass=3 and among male passengers. Correlating (#1).
Decisions.
Add Sex feature to model training.(需要考虑性别)
Complete and add Embarked feature to model training.(完善登陆信息)
# grid = sns.FacetGrid(train_df, col='Embarked')
grid = sns.FacetGrid(train_df, row='Embarked', size=2.2, aspect=1.6)
grid.map(sns.pointplot, 'Pclass', 'Survived', 'Sex', palette='deep')
grid.add_legend()
相关分类和数字特征
Observations.
Higher fare paying passengers had better survival. Confirms our assumption for creating (#4) fare ranges.(船费越贵生存率越高)
Port of embarkation correlates with survival rates. Confirms correlating (#1) and completing (#2).(登陆港口和生存率有关)
Decisions.
Consider banding Fare feature.(需要考虑船费)
# grid = sns.FacetGrid(train_df, col='Embarked', hue='Survived', palette={0: 'k', 1: 'w'})
grid = sns.FacetGrid(train_df, row='Embarked', col='Survived', size=2.2, aspect=1.6)
grid.map(sns.barplot, 'Sex', 'Fare', alpha=.5, ci=None)
grid.add_legend()
修正数据##
通过观察数据,其实我们有一些观察结论了,现在可以执行这些结论了
先删除一些特征
print("Before", train_df.shape, test_df.shape, combine[0].shape, combine[1].shape)

train_df = train_df.drop(['Ticket', 'Cabin'], axis=1)
test_df = test_df.drop(['Ticket', 'Cabin'], axis=1)
combine = [train_df, test_df]

"After", train_df.shape, test_df.shape, combine[0].shape, combine[1].shape
然后从现有特征中创造一些新的特征
Observations.
When we plot Title, Age, and Survived, we note the following observations.
Most titles band Age groups accurately. For example: Master title has Age mean of 5 years.(头衔和年龄链接紧密)
Survival among Title Age bands varies slightly.(年龄段和获救率联系紧密)
Certain titles mostly survived (Mme, Lady, Sir) or did not (Don, Rev, Jonkheer).(某些头衔获救率确实高,有些则不然)
Decision.
We decide to retain the new Title feature for model training.(保留头衔特征)使用正则表达式
for dataset in combine:
    dataset['Title'] = dataset.Name.str.extract(' ([A-Za-z]+)\.', expand=False)

pd.crosstab(train_df['Title'], train_df['Sex'])
把一些没卵用的头衔替换掉
for dataset in combine:
    dataset['Title'] = dataset['Title'].replace(['Lady', 'Countess','Capt', 'Col',\
    'Don', 'Dr', 'Major', 'Rev', 'Sir', 'Jonkheer', 'Dona'], 'Rare')

    dataset['Title'] = dataset['Title'].replace('Mlle', 'Miss')
    dataset['Title'] = dataset['Title'].replace('Ms', 'Miss')
    dataset['Title'] = dataset['Title'].replace('Mme', 'Mrs')

train_df[['Title', 'Survived']].groupby(['Title'], as_index=False).mean()
然后数字化
title_mapping = {"Mr": 1, "Miss": 2, "Mrs": 3, "Master": 4, "Rare": 5}
for dataset in combine:
    dataset['Title'] = dataset['Title'].map(title_mapping)
    dataset['Title'] = dataset['Title'].fillna(0)

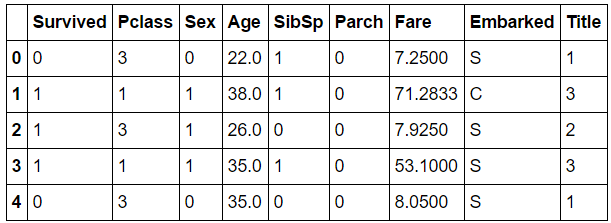
train_df.head()
然后再删除名字和旅客ID两个无用特征
train_df = train_df.drop(['Name', 'PassengerId'], axis=1)
test_df = test_df.drop(['Name'], axis=1)
combine = [train_df, test_df]
train_df.shape, test_df.shape
然后对性别进行数字化
for dataset in combine:
    dataset['Sex'] = dataset['Sex'].map( {'female': 1, 'male': 0} ).astype(int)

train_df.head()
然后开始完善一些特征,补充缺失值。首先是age
有三个考虑可以使用的方法来补充连续性的数值特征:
1.最简单的就是在均值到标准差内来个随机数
2.更准确一点的就是通过相关特征来猜测当前特征值。在这个例子中我们发现年龄与性别、座位级别这两个特征有关,所以用这两个特征分类的均值来代替特征值。
3.结合1、2两个方法
由于1、3会引入随机误差,这里作者更偏向于使用2
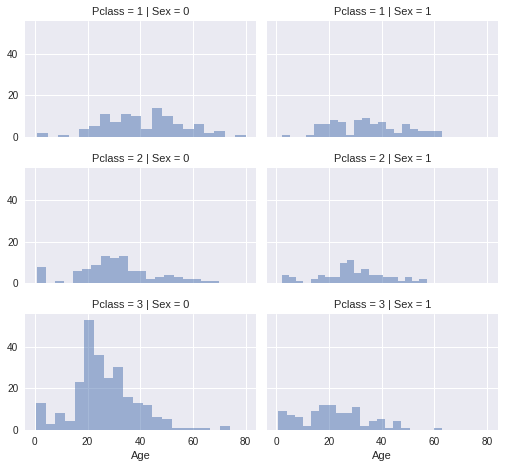
# grid = sns.FacetGrid(train_df, col='Pclass', hue='Gender')
grid = sns.FacetGrid(train_df, row='Pclass', col='Sex', size=2.2, aspect=1.6)
grid.map(plt.hist, 'Age', alpha=.5, bins=20)
grid.add_legend()
上图是不同年龄和性别组合下 年龄及人数分布
然后创建一个Array来准备fill年龄的空值
guess_ages = np.zeros((2,3))
guess_ages
然后迭代的通过性别、座席的六种组合来估计年龄均值
for dataset in combine:
    for i in range(0, 2):
        for j in range(0, 3):
            guess_df = dataset[(dataset['Sex'] == i) & \
                                  (dataset['Pclass'] == j+1)]['Age'].dropna()

            # age_mean = guess_df.mean()
            # age_std = guess_df.std()
            # age_guess = rnd.uniform(age_mean - age_std, age_mean + age_std)

            age_guess = guess_df.median()

            # Convert random age float to nearest .5 age
            guess_ages[i,j] = int( age_guess/0.5 + 0.5 ) * 0.5

    for i in range(0, 2):
        for j in range(0, 3):
            dataset.loc[ (dataset.Age.isnull()) & (dataset.Sex == i) & (dataset.Pclass == j+1),\
                    'Age'] = guess_ages[i,j]

    dataset['Age'] = dataset['Age'].astype(int)

train_df.head()
填补完空白值之后在对年龄离散化
train_df['AgeBand'] = pd.cut(train_df['Age'], 5)
train_df[['AgeBand', 'Survived']].groupby(['AgeBand'], as_index=False).mean().sort_values(by='AgeBand', ascending=True)
然后替换age
for dataset in combine:
    dataset.loc[ dataset['Age'] <= 16, 'Age'] = 0
    dataset.loc[(dataset['Age'] > 16) & (dataset['Age'] <= 32), 'Age'] = 1
    dataset.loc[(dataset['Age'] > 32) & (dataset['Age'] <= 48), 'Age'] = 2
    dataset.loc[(dataset['Age'] > 48) & (dataset['Age'] <= 64), 'Age'] = 3
    dataset.loc[ dataset['Age'] > 64, 'Age']
train_df.head()
然后就可以移除ageband这个过渡特征了
train_df = train_df.drop(['AgeBand'], axis=1)
combine = [train_df, test_df]
train_df.head()
从现有特征中组合出新特征各种花样
新特征FamiliySize是 Parch SibSp之和,加了新特征之后就可以把这两个去掉了
for dataset in combine:
    dataset['FamilySize'] = dataset['SibSp'] + dataset['Parch'] + 1

train_df[['FamilySize', 'Survived']].groupby(['FamilySize'], as_index=False).mean().sort_values(by='Survived', ascending=False)
毕竟还是有不少人是一个人的,所以可以创造个新特征isalone
for dataset in combine:
    dataset['IsAlone'] = 0
    dataset.loc[dataset['FamilySize'] == 1, 'IsAlone'] = 1

train_df[['IsAlone', 'Survived']].groupby(['IsAlone'], as_index=False).mean()
看了效果作者觉得isalone就行了,于是删除了FamilySize和前面那两个特征,但是我觉得familysize可以留着,后面有读者留言说留了之后泛化误差更低
train_df = train_df.drop(['Parch', 'SibSp', 'FamilySize'], axis=1)
test_df = test_df.drop(['Parch', 'SibSp', 'FamilySize'], axis=1)
combine = [train_df, test_df]

train_df.head()
作者又创造了一个新特征是Pclass与age的乘积
for dataset in combine:
    dataset['Age*Class'] = dataset.Age * dataset.Pclass

train_df.loc[:, ['Age*Class', 'Age', 'Pclass']].head(10)
也没说效果,感觉就是这个数字越大越完蛋,大家可以测试下
对于Embarked 这个特征代表了游客上船的港口,但是training dataset有些值缺失,作者就直接用频率最高的代替了
freq_port = train_df.Embarked.dropna().mode()[0]
freq_port
结果是S
for dataset in combine:
    dataset['Embarked'] = dataset['Embarked'].fillna(freq_port)

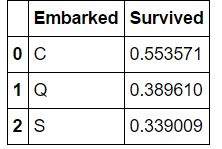
train_df[['Embarked', 'Survived']].groupby(['Embarked'], as_index=False).mean().sort_values(by='Survived', ascending=False)
生存率和上船的港口有关,越晚上船的可能越在上面更方便
然后把标签特征转换成离散型
for dataset in combine:
    dataset['Embarked'] = dataset['Embarked'].map( {'S': 0, 'C': 1, 'Q': 2} ).astype(int)

train_df.head()
然后需要填充fare这个特征,缺失值就用频率最高的那个值代替,然后对它离散化。
test_df['Fare'].fillna(test_df['Fare'].dropna().median(), inplace=True)
test_df.head()
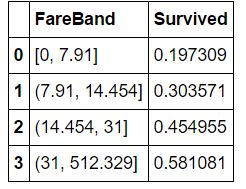
train_df['FareBand'] = pd.qcut(train_df['Fare'], 4)
train_df[['FareBand', 'Survived']].groupby(['FareBand'], as_index=False).mean().sort_values(by='FareBand', ascending=True)
for dataset in combine:
    dataset.loc[ dataset['Fare'] <= 7.91, 'Fare'] = 0
    dataset.loc[(dataset['Fare'] > 7.91) & (dataset['Fare'] <= 14.454), 'Fare'] = 1
    dataset.loc[(dataset['Fare'] > 14.454) & (dataset['Fare'] <= 31), 'Fare']   = 2
    dataset.loc[ dataset['Fare'] > 31, 'Fare'] = 3
    dataset['Fare'] = dataset['Fare'].astype(int)

train_df = train_df.drop(['FareBand'], axis=1)
combine = [train_df, test_df]

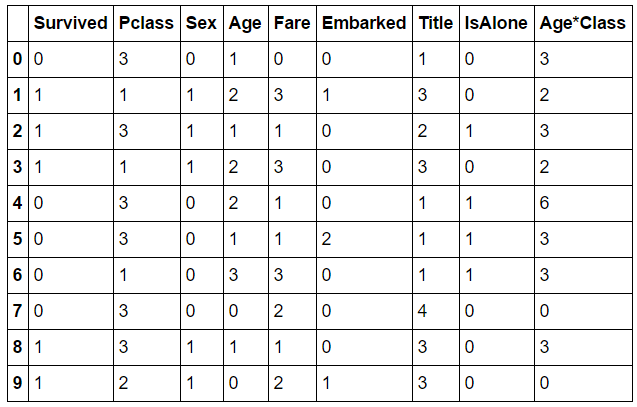
train_df.head(10)
test_df.head(10)
OK,到现在特征处理和数据分析、清洗、转换就做完了!下面就该放入模型预测了,有木有很激动?
Logistic Regression
KNN or k-Nearest Neighbors
Support Vector Machines
Naive Bayes classifier
Decision Tree
Random Forrest
Perceptron
Artificial neural network
RVM or Relevance Vector Machine
这些就不用翻译了吧
选择模型也是学问,首先确定自己要解决的是什么问题,然后想想各个算法的优劣势。
X_train = train_df.drop("Survived", axis=1)
Y_train = train_df["Survived"]
X_test  = test_df.drop("PassengerId", axis=1).copy()
X_train.shape, Y_train.shape, X_test.shape
# Logistic Regression

logreg = LogisticRegression()
logreg.fit(X_train, Y_train)
Y_pred = logreg.predict(X_test)
acc_log = round(logreg.score(X_train, Y_train) * 100, 2)
acc_log
80.359999999999999
看看不同特征与Ytrain的相关性
coeff_df = pd.DataFrame(train_df.columns.delete(0))
coeff_df.columns = ['Feature']
coeff_df["Correlation"] = pd.Series(logreg.coef_[0])

coeff_df.sort_values(by='Correlation', ascending=False)
# Support Vector Machines

svc = SVC()
svc.fit(X_train, Y_train)
Y_pred = svc.predict(X_test)
acc_svc = round(svc.score(X_train, Y_train) * 100, 2)
acc_svc
单模型里SVM还是很强大的
83.840000000000003
knn = KNeighborsClassifier(n_neighbors = 3)
knn.fit(X_train, Y_train)
Y_pred = knn.predict(X_test)
acc_knn = round(knn.score(X_train, Y_train) * 100, 2)
acc_knn
84.739999999999995
KNN也不错
# Decision Tree

decision_tree = DecisionTreeClassifier()
decision_tree.fit(X_train, Y_train)
Y_pred = decision_tree.predict(X_test)
acc_decision_tree = round(decision_tree.score(X_train, Y_train) * 100, 2)
acc_decision_tree
86.760000000000005
# Random Forest

random_forest = RandomForestClassifier(n_estimators=100)
random_forest.fit(X_train, Y_train)
Y_pred = random_forest.predict(X_test)
random_forest.score(X_train, Y_train)
acc_random_forest = round(random_forest.score(X_train, Y_train) * 100, 2)
acc_random_forest
86.760000000000005
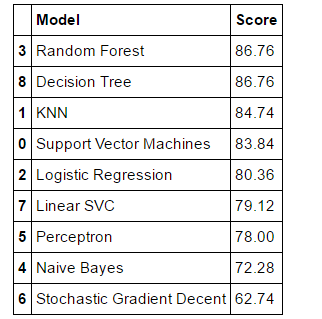
RF竟然和DT一样,有点吃惊
模型评价
models = pd.DataFrame({
    'Model': ['Support Vector Machines', 'KNN', 'Logistic Regression',
              'Random Forest', 'Naive Bayes', 'Perceptron',
              'Stochastic Gradient Decent', 'Linear SVC',
              'Decision Tree'],
    'Score': [acc_svc, acc_knn, acc_log,
              acc_random_forest, acc_gaussian, acc_perceptron,
              acc_sgd, acc_linear_svc, acc_decision_tree]})
models.sort_values(by='Score', ascending=False)
最后就可以提交结果咯
submission = pd.DataFrame({
        "PassengerId": test_df["PassengerId"],
        "Survived": Y_pred
    })
# submission.to_csv('../output/submission.csv', index=False)
那么这个介绍就到这里了,谢谢大家咯,See you!

