目录
- MCScanX下载及安装
- 数据准备
- MCScanX运行及结果
- Ka & Ks 计算
- 下游画图脚本
- 最后
MCScanX有两个主要的功能, 一是, 方便使用者发现共线性(collinearity)和同线性(synteny)关系并且可以从共线性区块中看到清晰多重比对; 二是, 通过其中众多的辅助脚本, 更形象的分析同线性和共线性的数据
下面就从零开始共线性的分析吧~
注: 稍微解释一下synteny and collinearity的关系, 假设有A B C三个基因, 在species1中的排列为ACB, 而在species2中排列为CAB, 则这两个区段称为synteny; 如果在species3中排列为ABC, 在species4中排列也为ABC, 则这两个区段称为collinearity
MCScanX下载及安装
$wget http://chibba.pgml.uga.edu/mcscan2/MCScanX.zip
$unzip MCScanX.zip
$cd MCScanX
$make
这部分我是在华为云服务器上完成的, 因为很多东西没装, 所以一直报错, 报错内容及解决办法记录如下:
- 报错1
make: g++: Command not found
- 解决办法1
$conda install gcc=4.8.5
- 报错2
g++ struct.cc mcscan.cc read_data.cc out_utils.cc dagchainer.cc msa.cc permutation.cc -o MCScanX
msa.cc: In function ‘void msa_main(const char*)’:
msa.cc:289:22: error: ‘chdir’ was not declared in this scope
     if (chdir(html_fn)<0)
                      ^
makefile:2: recipe for target 'mcscanx' failed
make: *** [mcscanx] Error 1
- 解决办法2
错误的原因是MCScanX 不支持64位系统, 如果要在 64位上运行, 需要在msa.h,dissect_multiple_alignment.h, anddetect_collinear_tandem_arrays.h第一行加上
#include
- 报错3
can't find javac
- 解决办法3
一般正常服务器哪有不配java的, 我也是醉了
$yum -y install java-1.8.0-openjdk-devel.x86_64
数据准备
安装完成后, 软件包包括三个主程序MCScanX, MCScanX_h, duplicate_gene_classifier, 和13个用于形象化展示的下游分析软件
本次分析只用到了MCScanX和几个下游脚本
BLASTP
- 建库
$makeblastdb -in pde_ptr_pep.fasta -dbtype prot -parse_seqids -out pep.db/pde_ptr
- 比对
以下是qsub脚本内容, 比对之前要检查一下序列名称是否跟待会要用的 gff 文件序列名称是否一致, 不一致的话可以在vim中通过:%s/XXX/xxx/g修改
#PBS -N pdeptr_blastp
#PBS -l nodes=1:ppn=62
#PBS -l walltime=1200:00:00
#PBS -q long
cd /home/Dai_XG/Analysis/Pdel_genome/05.evolution_analysis/05.colinearity/out_01
blastp -query \pde_ptr_pep.fasta -out pde_ptr_pep.fasta.blastpout -db pep.db/pdeptr -outfmt 6 -evalue 1e-5 -num_threads 62
特定GFF生成
需要的格式只有四列信息, 分别是染色体ID, 基因ID, 起始和终止, 以下命令行是对基因注释文件操作的
如果只想做特定序列的结果, 在这一步中筛出来就行, 不用动上边的 blast 结果
#具体文件具体分析
$grep '\smRNA\s' EVM.final.gene.gff3 | awk '{print $1"\t"$4"\t"$5"\t"$9}' |awk -F 'ID=' '{print $1$2}'|awk -F 'Parent=' '{print $1}'|awk '{print $1"\t"$4"\t"$2"\t"$3}' >pde.gff
$grep '\smRNA\s' Ptrichocarpa_444_v3.1.gene.gff3 | awk '{print $1"\t"$4"\t"$5"\t"$9}'|awk -F '.v3.1;' '{print $1}'|awk -F 'ID=' '{print $1$2}'|awk '{print $1"\t"$4"\t"$2"\t"$3}' > ptr.gff
MCScanX运行及结果
运行命令行
$nohup MCScanX pde_ptr > out.log 2>&1 &
结果
运行完成后会生成三个结果文件
pde_ptr.collinearity-
pde_ptr.html(目录) pde_ptr.tandem
pde_ptr.collinearity
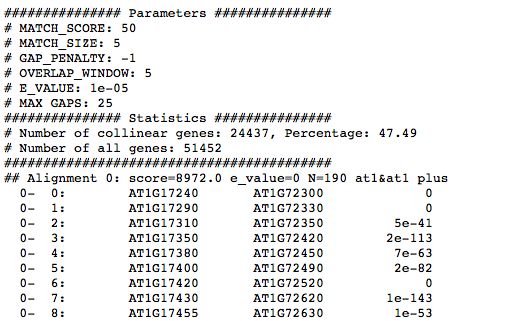
就不粘自己电脑上的图了, 偷张别人的图说一下
- 第一部分为执行参数
- 第二部分两行给出了共线性基因的数目和比率, 及所有基因的数目
- 第三部分全部为 block, 也就是比对出来的共线性区块
1.第一列为 block 编号
2.第二列为 block 内部, 比对基因的编号
3.第三列为&前边染色体的基因
4.第四列为&后边染色体的基因
5.第五列 e_value 值, 跟 blast 一样
pde_ptr.html
目录中包含所有 block 的.html 文件
- 第一列为与参考片段相应基因匹配上的基因数目
- 第二列参考片段, 基因按顺序排列
-
第三列匹配上的片段
pde_ptr.tandem
串联重复的基因, 也不知道有啥用
Ka & Ks 计算
上边说了, MCScanX有很多下游分析脚本, 我这几篇文章都是在记录之前做的进化分析流程, 其中流程中做过KaKs的统计计算, 下面就着重介绍一下, 关于其他下游脚本, 将在下一章节介绍
定义
- Ka/Ks或者dN/dS表示异义突变率(Ka)和同义突变率(Ks)之间的比例
- 计算
Ks = 同义突变SNP数/同义位点数
Ka = 异义突变SNP数/异义位点数- 关于同/异义位点数的理解
以TTT密码子为例, 单(双/三)碱基发生变异, 会有9(15*2/63)种变异位点数, 通过比照密码子表发现, 1(未统计)种为同义, 8(未统计)种为异义, 以此类推, 序列的同/异义位点数要依次统计每个密码子变异后的情况, 也就是说分母为整条序列所有单碱基变异的可能之和 - 关于同/异义突变SNP数的理解
以密码子TTT为例, 突变为GAC(以上所说的三碱基突变)自然是有三个SNP突变数, 但此突变数非彼突变数, 因为我们不知道变异过程究竟是怎么样的, 所以要遍历整个变异流程, 然后统计整个变异流程中的同/异义的数目, 最后取平均值, TTT变为GAC有6中流程, 过程中有14中异义突变SNP数, 4种同义突变SNP数, 故同义突变SNP数 = 4/6, 异义突变SNP数 = 14/6
- 关于同/异义位点数的理解
- Ka>>Ks或者Ka/Ks >> 1, 基因受正选择(positive selection); Ka=Ks或者Ka/Ks =1, 基因中性进化; Ka<
- 可以参考用以判断选择压力的Ka/Ks的计算
数据准备
- CDS序列
合并物种的 cds 序列文件, 序列名称与.collinearity中一定要一致, 不然会发现结果中全都是-2 -2 -2 -2 ... - 上一步生成的 .collinearity
软件配置
这一步需要下游脚本add_ka_and_ks_to_synteny.pl, 如果你也是普通用户, 那么就很操蛋了, 要手动下载安装很多个perl model, 还要装ClustalX, 而且必须是2.0版本以前的
- 搞定
ClustalW
$wget http://www.clustal.org/download/1.X/ftp-igbmc.u-strasbg.fr/pub/ClustalW/clustalw1.83.linux.tar.gz
$tar zxvf clustalw1.83.linux.tar.gz
$vi ~/.bash_profile
export PATH=/home/Dai_XG/software/clustalw1.83.linux:$PATH
-
Bio-Tools-Run-Alignment-Clustalw安装
报错提示没有记录, 反正意思就是你没有这个库, 我运行不了
$wget https://cpan.metacpan.org/authors/id/C/CD/CDRAUG/Bio-Tools-Run-Alignment-Clustalw-1.7.4.tar.gz
$tar zxvf Bio-Tools-Run-Alignment-Clustalw-1.7.4.tar.gz
$cd Bio-Tools-Run-Alignment-Clustalw
$perl Makefile.PL PREFIX=/home/Dai_XG/software/prefix/perl_local_lib
$make
$make test
$make install
-
Devel-CheckBin安装
$wget https://cpan.metacpan.org/authors/id/T/TO/TOKUHIROM/Devel-CheckBin-0.04.tar.gz
$tar zxvf Devel-CheckBin-0.04.tar.gz
$cd Devel-CheckBin-0.04
$perl Makefile.PL PREFIX=/home/Dai_XG/software/prefix/perl_local_lib
$make
$make test
$make install
-
BioPerl-Run安装
$wget https://cpan.metacpan.org/authors/id/C/CJ/CJFIELDS/BioPerl-Run-1.007002.tar.gz
$tar zxvf BioPerl-Run-1.007002.tar.gz
$cd BioPerl-Run-1.007002
这是Bioperl, 手动形式跟上边的不同, 我是在没找到普通用户的管理方法, 但发现目录下有一个lib 目录, 把它写入环境竟然也能用, 太好了~~
- 写入环境
$vi ~/.bash_profile
export PERL5LIB=/home/Dai_XG/software/prefix/perl_local_lib/lib/site_perl/5.28.0/:/home/Dai_XG/software/BioPerl-Run-1.007002/lib/:$PERL5LIB
export PATH=/home/Dai_XG/software/clustalw1.83.linux:$PATH
运行及结果
终于能用了, 太烦了
- 运行
$nohup perl ~/software/MCScanX/downstream_analyses/add_ka_and_ks_to_collinearity.pl -i ../../../out_03_1/chr_result/pde_ptr.collinearity -d pde_ptr.fasta -o pde_ptr.kaks > out.log 2>&1& - 结果
在.collinearity结果基础上多了两列, 分别是Ka&Ks
自编脚本处理
两个脚本太长了, 备份里找吧, 名称为
extract_peak.kaks.pl,statistics_block.pl
-
extract_peak.kaks结果
Chr&LachesisXXgroup
-19990  2318
0       1052
220     819
200     805
...
Chr&Chr
-19990  810
2320    73
2280    73
...
LachesisXXgroup&LachesisXXgroup
-19990  2430
2290    76
2160    67
-
statistics_block结果1
## BLOCK 1      Chr01   2133    LachesisXXgroup0        1624    Ks
0       Chr01   Potri.001G064150.1      5052138 5053352 -2
1       Chr01   Potri.001G064301.1      5072110 5072703 -2
2       Chr01   Potri.001G065600.1      5191942 5199150 -2
...
0       LachesisXXgroup0        EVM0035433.1    4924636 4927232 -2
1       LachesisXXgroup0        EVM0024093.1    5012566 5014702 -2
2       LachesisXXgroup0        EVM0031968.1    5107185 5112594 -2
...
## BLOCK 2      Chr01   2118    LachesisXXgroup0        1564    Ks
0       Chr01   Potri.001G290600.3      29621454        29622702        -2
1       Chr01   Potri.001G290800.3      29637348        29639177        -2
2       Chr01   Potri.001G291866.1      29721339        29722599        -2
...
-
statistics_block结果2
BLOCK   species blocklength     colinearity genes       block genes with no colinearity
BLOCK1  Chr01   20138601        1344    789     LachesisXXgroup0        20266103        1344    280
BLOCK2  Chr01   20866914        1135    983     LachesisXXgroup0        21403547        1135    429
BLOCK3  Chr01   5024695 434     330     LachesisXXgroup0        5147359 434     157
BLOCK4  Chr01   3688015 309     201     LachesisXXgroup0        4407659 309     86
BLOCK5  Chr01   1523936 21      91      LachesisXXgroup0        1523936 21      62
BLOCK6  Chr01   226943  10      25      LachesisXXgroup0        404525  10      36
BLOCK7  Chr01   308614  9       25      LachesisXXgroup0        308614  9       8
BLOCK8  Chr01   929669  10      71      LachesisXXgroup0        1682958 10      26
BLOCK9  Chr01   1606860 10      104     LachesisXXgroup0        2277577 10      123
BLOCK10 Chr01   38729   6       2       LachesisXXgroup0        143832  6       0
BLOCK11 Chr01   385605  7       44      LachesisXXgroup0        6302890 7       55
BLOCK12 Chr01   80612   6       6       LachesisXXgroup0        42799884        6       30
...
下游画图脚本
这里尽可能多的吧脚本都跑一遍吧, 实在没法跑的以后补充
每个脚本运行前需要.java 及.class 同时存在才可以
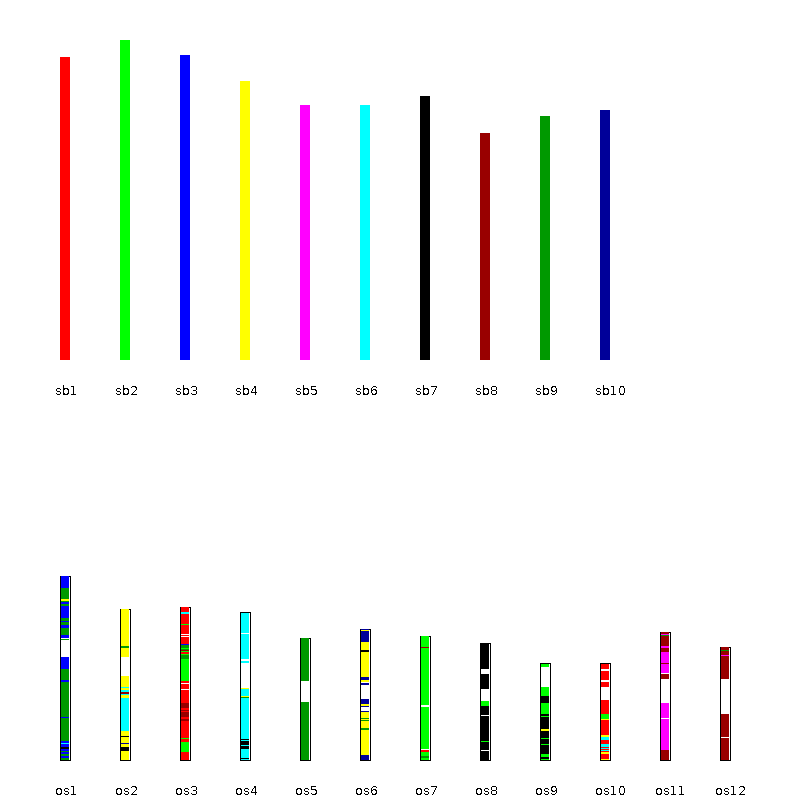
bar_plotter.java
- 配置文件
2000    //dimension (in pixels) of x axis
2000    //dimension (in pixels) of y axis
Chr01,Chr02,Chr03,Chr04,Chr05,Chr06,Chr07,Chr08,Chr09,Chr10,Chr11,Chr12,Chr13,Chr14,Chr15,Chr16,Chr17,Chr18,Chr19       //reference chromosomes
Lachesis_group0,Lachesis_group1,Lachesis_group2,Lachesis_group3,Lachesis_group4,Lachesis_group5,Lachesis_group6,Lachesis_group7,Lachesis_group8,Lachesis_group9,Lachesis_group10,Lachesis_group11,Lachesis_group12,Lachesis_group13,Lachesis_group14,Lachesis_group15,Lachesis_group16,Lachesis_group17,Lachesis_group18        //target chromosomes
- 运行
$java dot_plotter -g gff_file -s collinearity_file -c control_file -o output_PNG_file
-
输出
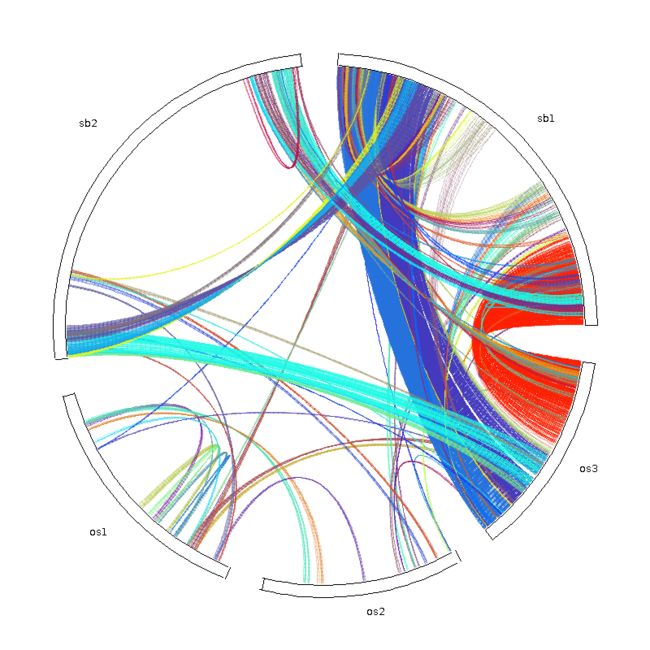
circle_plotter.java
- 配置文件
800     //plot width and height (in pixels)
Chr01,Chr02,Chr03,Chr04,Chr05,Chr06,Chr07,Chr08,Chr09,Chr10,Chr11,Chr12,Chr13,Chr14,Chr15,Chr16,Chr17,Chr18,Chr19,Lachesis_group0,Lachesis_group1,Lachesis_group2,Lachesis_group3,Lachesis_group4,Lachesis_group5,Lachesis_group6,Lachesis_group7,Lachesis_group8,Lachesis_group9,Lachesis_group10,Lachesis_group11,Lachesis_group12,Lachesis_group13,Lachesis_group14,Lachesis_group15,Lachesis_group16,Lachesis_group17,Lachesis_group18  //chromosomes in the circle
- 运行
$java circle_plotter -g gff_file -s collinearity_file -c control_file -o output_PNG_file
-
输出
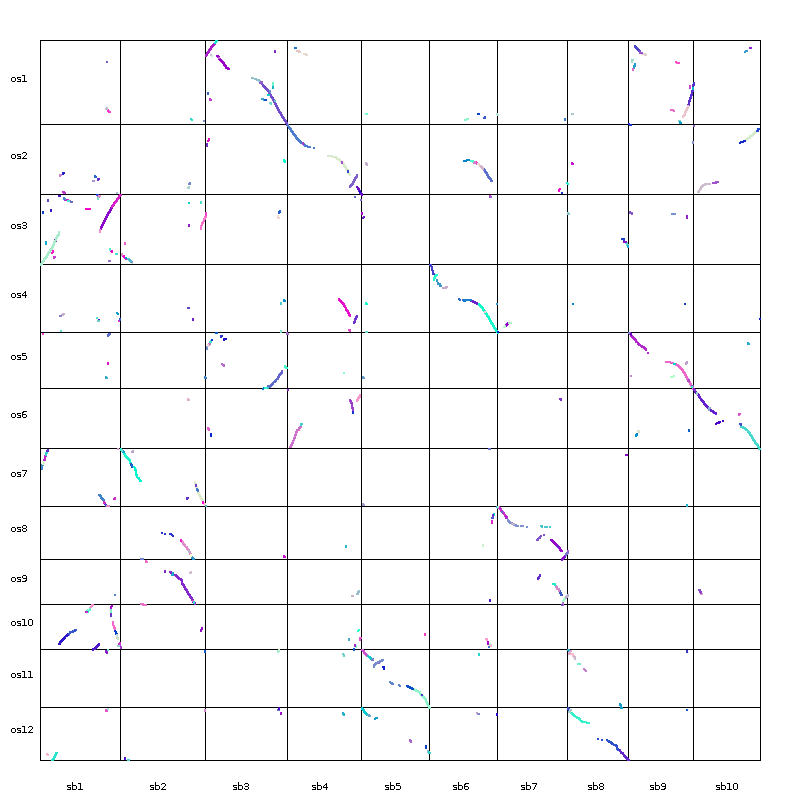
dot_plotter.java
- 配置文件
800     //dimension (in pixels) of x axis
800     //dimension (in pixels) of y axis
sb1,sb2,sb3,sb4,sb5,sb6,sb7,sb8,sb9,sb10        //chromosomes in x axis
os1,os2,os3,os4,os5,os6,os7,os8,os9,os10,os11,os12      //chromosomes in y axis
- 运行
$java dot_plotter -g gff_file -s collinearity_file -c control_file -o output_PNG_file
-
输出
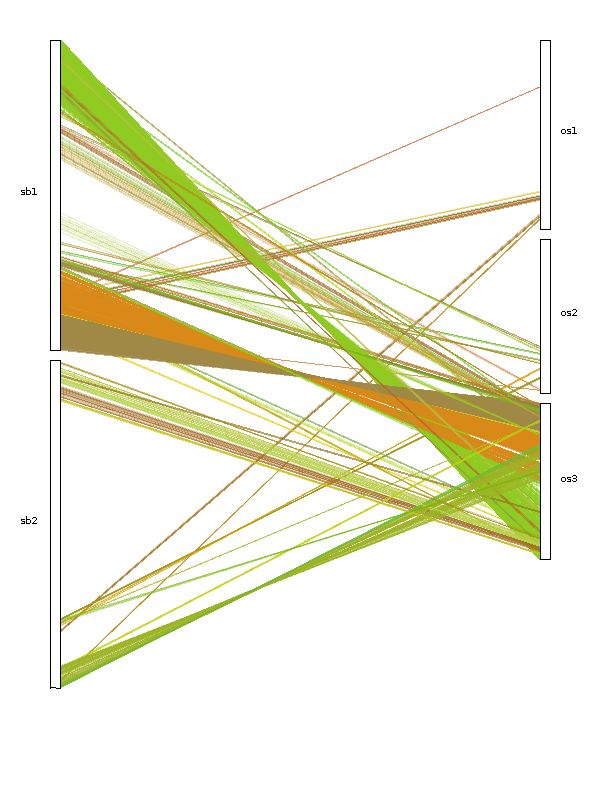
dual_synteny_plotter.java
- 配置文件
6000    //plot width (in pixels)
20000   //plot height (in pixels)
Chr01,Chr02,Chr03,Chr04,Chr05,Chr06,Chr07,Chr08,Chr09,Chr10,Chr11,Chr12,Chr13,Chr14,Chr15,Chr16,Chr17,Chr18,Chr19,      //chromosomes in the left column
Lachesis_group0,Lachesis_group1,Lachesis_group2,Lachesis_group3,Lachesis_group4,Lachesis_group5,Lachesis_group6,Lachesis_group7,Lachesis_group8,Lachesis_group9,Lachesis_group10,Lachesis_group11,Lachesis_group12,Lachesis_group13,Lachesis_group14,Lachesis_group15,Lachesis_group16,Lachesis_group17,Lachesis_group18,       //chromosomes in the right column
- 运行
$java dual_synteny_plotter -g gff_file -s collinearity_file -c control_file -o output_PNG_file
-
输出
最后
- 还有几篇关于进化的笔记隐藏了, 欢迎小伙伴们一起来交流学习
-
终于看到头了
