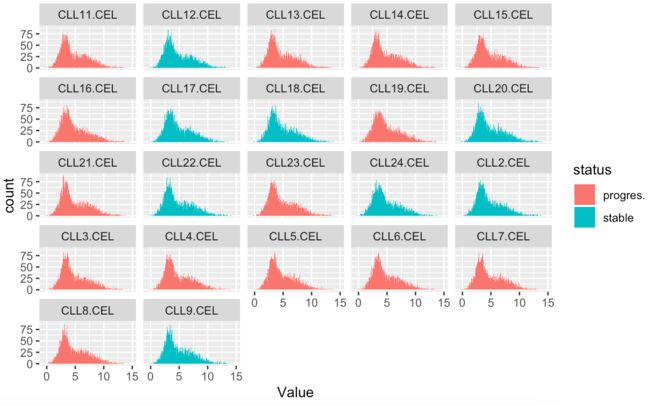
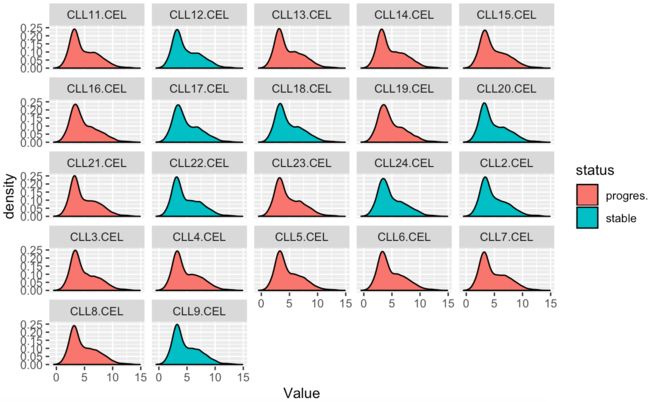
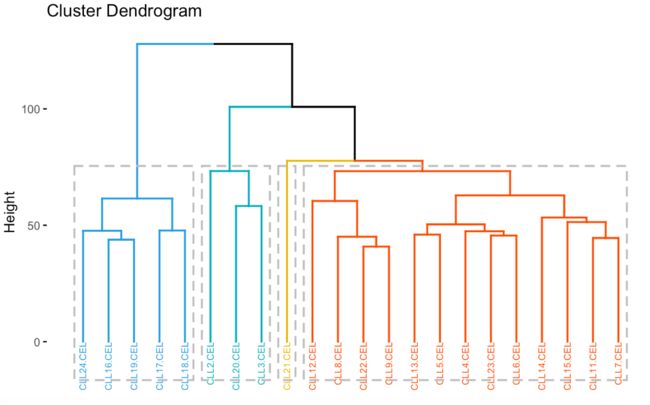
11.对第10步得到的表达矩阵进行探索,先画第一个样本的所有基因的表达量的boxplot,hist,density , 然后画所有样本的这些图
- 参考:http://bio-info-trainee.com/tmp/basic_visualization_for_expression_matrix.html
- 理解ggplot2的绘图语法,数据和图形元素的映射关系
11.1 准备工作获得表达矩阵和分组信息
rm(list = ls())  ## 魔幻操作,一键清空~
options(stringsAsFactors = F)
library(ALL)
library(CLL)
library(pasilla)
library(airway)
library(DESeq2)
library(clusterProfiler )
library(reshape2)
library(ggplot2)
library(hgu95av2.db)

data(sCLLex)
eset <- exprs(sCLLex)
eset[1:4,1:4]

head(toTable(hgu95av2SYMBOL))
ids <- hgu95av2SYMBOL
length(ids)
probe_in <- mappedkeys(ids)
length(probe_in)
gene_in <- as.list(ids[probe_in])
length(gene_in)
gene_symbol <- toTable(ids[probe_in])
dim(eset)
head(gene_symbol)
#对原始表达矩阵过滤
data_filter <- eset[rownames(eset)%in%probe_in,]
table(rownames(eset)%in%probe_in)
table(rownames(eset) %in% rownames(data_filter))

# 对过滤后的表达值的数据根据探针名称进行排序
data_filter_order <- data_filter[order(rownames(data_filter)),]
# 对gene_symbol按照探针名称进行排序
gene_symbol_order <- gene_symbol[order(gene_symbol$probe_id),]
# 查看地表达值的矩阵的名称是否与gene_symbol中的探针名称是否一一对应
table(gene_symbol_order$probe_id == rownames(data_filter_order))
#由于有的基因名对应了多个探针,用取最大平均值的方式去掉重复的探针
row_mean <- apply(data_filter_order,1,mean)
head(row_mean)

# 构建函数,用来计算筛选
index_probe <- function(x){
  names(x)[which.max(x)]
}
# index_probe这个函数的功能在于,用gene_symbol$symol(基因名)对row_mean进行分组,然后挑出相同基因中表达值最大的那个值所对应的探针编号
max_index <- tapply(row_mean,gene_symbol$symbol,index_probe)
# gene_symbol_order与data_filter_order都按照探针名称进行排序,再挑出max_index中的探针哪些在gene_symbol_order$probe_id中
data_filter_order_unique <- data_filter_order[(gene_symbol_order$probe_id %in% max_index),]
# 将data_filter_order_unique那些与gene_symbol_order$probe_id对应起来的探针与基因名提取出来
unique_map_gene_probe <- gene_symbol_order[(gene_symbol_order$probe_id %in% rownames(data_filter_order_unique)),]
#找到在包里对应了基因symbol的探针有8585个
table(unique_map_gene_probe$probe_id == rownames(data_filter_order_unique))
# 可以发现,unique_map_gene_probe$probe_id中的探针顺序与data_filter_order_unique中的探针顺序是致的
rownames(data_filter_order_unique) <- unique_map_gene_probe$symbol
exprset <- data_filter_order_unique
group_list <- pData(sCLLex)
# 将最终过滤后的矩阵的名称换为基因名
save(exprset,group_list, file = "CLLoutput.Rdata")
11.2 绘图
rm(list = ls())  ## 魔幻操作,一键清空~
options(stringsAsFactors = F)
library(ggplot2)
library(reshape2)
load(file = "CLLoutput.Rdata")
data_draw <- melt(exprset)
colnames(data_draw) <- c("Gene","Group","Value")
data_draw$status <- rep(group_list$Disease,each=nrow(exprset))
#箱线图
p <- ggplot(data=data_draw,aes(x=Group,y=Value,fill=status))+ geom_boxplot()
p <- p + theme(axis.text.x = element_text(angle=45,hjust=1,vjust=1))
p
#小提琴图
p <- ggplot(data=data_draw,aes(x=Group,y=Value,fill=status))+ geom_violin()
p <- p + theme(axis.text.x = element_text(angle=45,hjust=1,vjust=1))
p
#密度图-histogram
p <- ggplot(data=data_draw,aes(x=Value,fill=status))+ geom_histogram(bins=500)
p <- p + facet_wrap(~Group,nrow=5)
p
#密度图-density
p <- ggplot(data=data_draw,aes(x=Value,fill=status))+ geom_density()
p <- p + facet_wrap(~Group,nrow=5)
p
聚类分析1
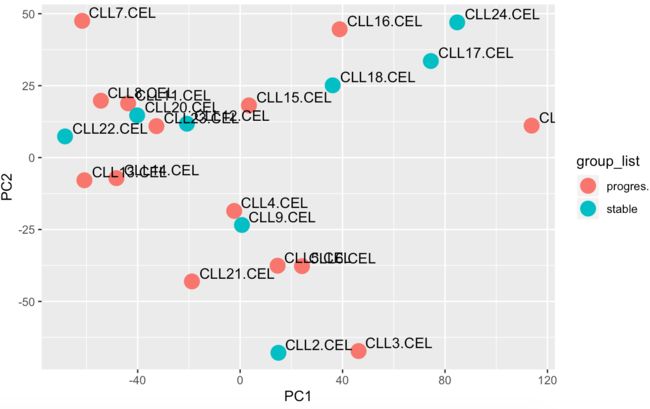
#PCA图聚类过滤前
data(sCLLex)
eset <- exprs(sCLLex)
data_expression <- eset
group_list=as.character(group_list$Disease)
pca_data <- prcomp(t(data_expression),scale=TRUE)
pcx <- data.frame(pca_data$x)
pcr <- cbind(samples=rownames(pcx),group_list, pcx)
p  <- ggplot(pcr, aes(PC1, PC2))+geom_point(size=5, aes(color=group_list)) +
  geom_text(aes(label=samples),hjust=-0.1, vjust=-0.3)
p
#过滤后
data_expression <- exprset
group_list=as.character(group_list$Disease)
pca_data <- prcomp(t(data_expression),scale=TRUE)
pcx <- data.frame(pca_data$x)
pcr <- cbind(samples=rownames(pcx),group_list, pcx)
p  <- ggplot(pcr, aes(PC1, PC2))+geom_point(size=5, aes(color=group_list)) +
  geom_text(aes(label=samples),hjust=-0.1, vjust=-0.3)
p
聚类分析2
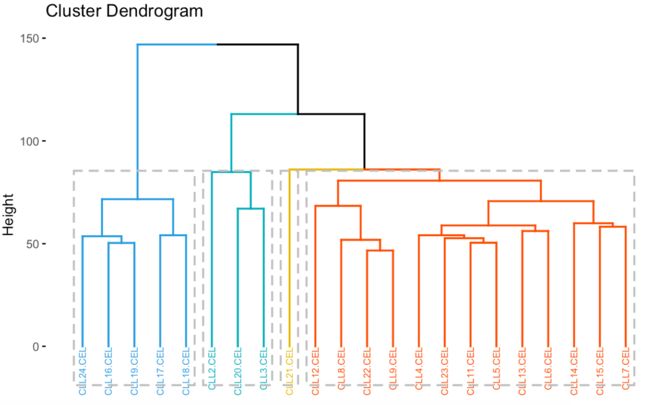
#过滤前hclust聚类
#BiocManager::install("factoextra")
data_clust <- t(data_expression)
rownames(data_clust) <- colnames(data_expression)
data_clust_dist <- dist(data_clust,method="euclidean")
hc <-hclust(data_clust_dist,"ward")
library(factoextra)
fviz_dend(hc, k = 4,
          cex = 0.5,
          k_colors = c("#2E9FDF", "#00AFBB", "#E7B800", "#FC4E07"),
          color_labels_by_k = TRUE, rect = TRUE)
#过滤后hclust聚类
data_expression <- exprset
data_clust <- t(data_expression)
rownames(data_clust) <- colnames(data_expression)
data_clust_dist <- dist(data_clust,method="euclidean")
hc <-hclust(data_clust_dist,"ward")
library(factoextra)
fviz_dend(hc, k = 4,
          cex = 0.5,
          k_colors = c("#2E9FDF", "#00AFBB", "#E7B800", "#FC4E07"),
          color_labels_by_k = TRUE, rect = TRUE)
12.理解统计学指标mean,median,max,min,sd,var,mad并计算出每个基因在所有样本的这些统计学指标,最后按照mad值排序,取top 50 mad值的基因,得到列表。
注意:这个题目出的并不合规,请仔细看。
mean,median,max,min,sd,var,mad中除了var,mad外,其余的好理解,下面先介绍一下var。BiocGenerics和stats
- 这2个包中均有这个函数,查找了说明书里的例子,还是没有太理解,只搞清楚了它是比较整数的某种关系的函数。
Description
var, cov and cor compute the variance of x and the covariance or correlation of x and y if these are vectors. If x and y are matrices then the covariances (or correlations) between the columns of x and the columns of y are computed.
用法
var(x, y = NULL, na.rm = FALSE, use)
参数释义:
x
a numeric vector, matrix or data frame.
y
NULL (default) or a vector, matrix or data frame with compatible dimensions to x. The default is equivalent to y = x (but more efficient).
na.rm
logical. Should missing values be removed?
use
an optional character string giving a method for computing covariances in the presence of missing values. This must be (an abbreviation of) one of the strings "everything", "all.obs", "complete.obs", "na.or.complete", or "pairwise.complete.obs".
例子
> var(1:10)
[1] 9.166667
> var(1:5, 1:5)
[1] 2.5
> c(1:5, 1:5)
 [1] 1 2 3 4 5 1 2 3 4 5
> var(c(1:5, 1:5))
[1] 2.222222
> var(2.5,2.222222)
[1] NA
- 然后是
mad函数,指的是绝对中位数差(median absolute deviation),
Description
Compute the median absolute deviation, i.e., the (lo-/hi-) median of the absolute deviations from the median, and (by default) adjust by a factor for asymptotically normal consistency.
用法
mad(x, center = median(x), constant = 1.4826, na.rm = FALSE,
    low = FALSE, high = FALSE)
例子
> mad(c(1:9))
[1] 2.9652
> print(mad(c(1:9),constant = 1)) ==
+   mad(c(1:8, 100), constant = 1)
[1] 2
[1] TRUE
> x <- c(1,2,3,5,7,8)
> sort(abs(x - median(x)))
[1] 1 1 2 3 3 4
> c(mad(x, constant = 1),
+   mad(x, constant = 1, low = TRUE),
+   mad(x, constant = 1, high = TRUE))
[1] 2.5 2.0 3.0
释义:其中,x数值向量;center可选,是中心点,默认是中位数;constant是缩放因子(scale factor),na.rm如果是TRUE,在计算前将x中的NA删除,low如果是TRUE,计算lo-median,也就是说,对于个数为偶数的样本,在最后计算中位数时不使用两个中间值的均值,而是采用其中较小的值。high如果为TRUE,计算‘hi-median’,也就是对于偶数样本,采用两个中间值的较大者作为中位数。
了解了背景之后提取top 50 mad值的基因得到列表
rm(list = ls())  ## 魔幻操作,一键清空~
options(stringsAsFactors = F)
load(file = 'CLLoutput.Rdata')
group_list=as.character(group_list$Disease)
data_mad <- apply(exprset,1,mad)
head(data_mad)
data_mad_50 <- head(sort(data_mad,decreasing = TRUE),50)
- 具体还可以参考StatQuest系列笔记汇总及相关视频了解统计相关内容
13.根据第12步骤得到top 50 mad值的基因列表来取表达矩阵的子集,并且热图可视化子表达矩阵。试试看其它5种热图的包的不同效果。
data_mad_30 <- head(sort(data_mad,decreasing = TRUE),30)
data_mad_30
data_mad_30_names <- names(data_mad_30)
data_mad_30_names
data_mad_30_hp <- exprset[data_mad_30_names,]
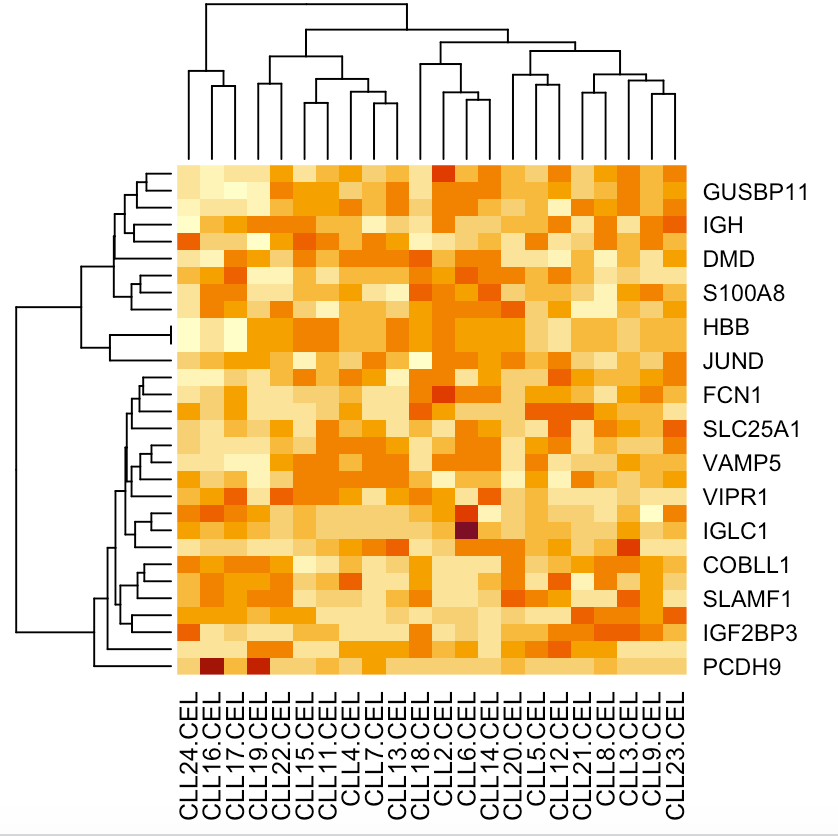
#heatmap1
heatmap(data_mad_30_hp)
#heatmap2
library(gplots)
heatmap.2(data_mad_30_hp,scale="row")
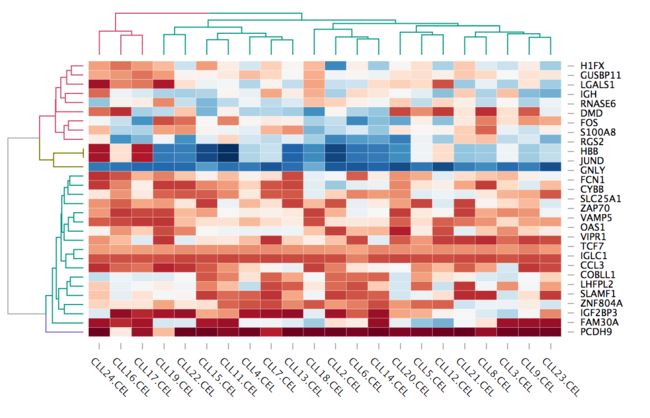
#heatmap3
if (!require("devtools"))
  install.packages("devtools")
devtools::install_github("rstudio/d3heatmap")
library(d3heatmap)
d3heatmap(data_mad_30_hp, colors = "RdBu", k_row = 4, k_col = 2)
# colors是颜色,k_row是行的聚类数目,用不同的颜色标记了出来,k_col是列的聚类数目
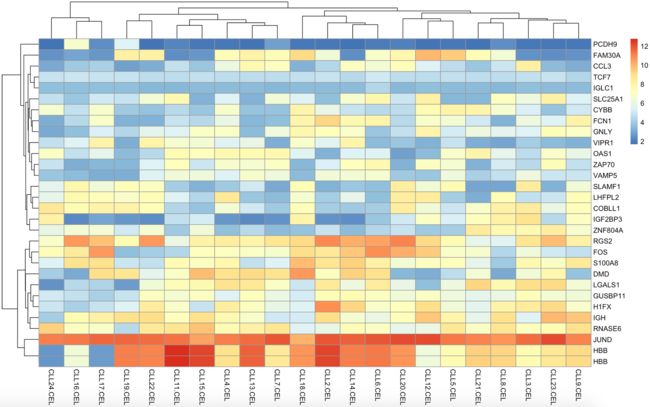
接着是第四个热图函数,虽然有警告,但是还是能看到图。
#heatmap4
BiocManager::install("ComplexHeatmap")
BiocManager::install("grid")
library(ComplexHeatmap)
Heatmap(data_mad_30_hp,name="Mad 30")
输出结果
Warning messages:
1: package ‘grid’ is not available (for R version 3.6.1)
2: package ‘grid’ is a base package, and should not be updated
> library(ComplexHeatmap)
> Heatmap(data_mad_30_hp,name="Mad 30")
最后是第五种热图的画法
#heatmap5
library(pheatmap)
pheatmap(data_mad_30_heatmap)
14.取不同统计学指标mean,median,max,mean,sd,var,mad的各top50基因列表,使用UpSetR包来看他们之间的overlap情况。
data_mean = tail(sort(apply(exprset,1,mean)),30)
data_median = tail(sort(apply(exprset,1,median)), 30)
data_max <- tail(sort(apply(exprset,1,max)),30)
data_min <- tail(sort(apply(exprset,1,min)),30)
data_sd <- tail(sort(apply(exprset,1,sd)),30)
data_var <- tail(sort(apply(exprset,1,var)),30)
data_mad <- tail(sort(apply(exprset,1,mad)),30)
data_all <- unique(c(names(data_mean),names(data_median),names(data_max),names(data_min),
                     names(data_sd),names(data_var),names(data_mad)))

# 取并集
data_upset <- data.frame(data_all,
                         data_mean=ifelse(data_all %in% names(data_mean) ,1,0),
                         data_median=ifelse(data_all %in% names(data_median) ,1,0),
                         data_max=ifelse(data_all %in% names(data_max) ,1,0),
                         data_min=ifelse(data_all %in% names(data_min) ,1,0),
                         data_sd=ifelse(data_all %in% names(data_sd) ,1,0),
                         data_var=ifelse(data_all %in% names(data_var) ,1,0),
                         data_mad=ifelse(data_all %in% names(data_mad) ,1,0))
# 生成一个数据框,内容是不同的统计量是在并集中的重合,如果在为1,不在为0

library("UpSetR")
upset(data_upset,nsets = 7,sets.bar.color = "#56B4E9")
15 在第二步的基础上面提取CLL包里面的data(sCLLex)数据对象的样本的表型数据。
查看上面的的内容即可
16 对所有样本的表达矩阵进行聚类并且绘图,然后添加样本的临床表型数据信息(更改样本名)
查看上面的的内容即可
17 对所有样本的表达矩阵进行PCA分析并且绘图,同样要添加表型信息。
查看上面的的内容即可
18 根据表达矩阵及样本分组信息进行批量T检验,得到检验结果表格
#group_list前面绘图的时候已经因子化了从新开始一个新的窗口操作
rm(list = ls())  ## 魔幻操作,一键清空~
options(stringsAsFactors = F)
load(file = 'CLLoutput.Rdata')

group_list=group_list$Disease
gl=as.factor(group_list)
gl
group1 = which(group_list== levels(gl)[1])
group1
group2 = which(group_list == levels(gl)[2])
group2
data_t1 = exprset[, group1]
#将表型为progres的样本选出来
data_t2 = exprset[, group2]
#将表型为stable的样本选出来
data_t = cbind(data_t1, data_t2)
pvals = apply(exprset, 1, function(x){
  t.test(as.numeric(x)~group_list)$p.value
})
p.adj = p.adjust(pvals, method = "BH")
#progres是对照组
data_mean_1 = rowMeans(data_t1)
#stable是使用药物处理后的——处理组
data_mean_2 = rowMeans(data_t2)

log2FC = data_mean_2-data_mean_1
DEG_t.test = cbind(data_mean_1, data_mean_2, log2FC, pvals, p.adj)
DEG_t.test=DEG_t.test[order(DEG_t.test[,4]),] #从小到大排序
DEG_t.test=as.data.frame(DEG_t.test)
head(DEG_t.test)
write.csv(DEG_t.test, file = 'DEG_t.test.csv')
输出前6行结果如下
> head(DEG_t.test)
       data_mean_1 data_mean_2     log2FC        pvals     p.adj
SGSM2     7.875615    8.791753  0.9161377 1.629755e-05 0.1399145
PDE8A     6.622749    7.965007  1.3422581 4.058944e-05 0.1656600
DLEU1     7.616197    5.786041 -1.8301554 6.965416e-05 0.1656600
LDOC1     4.456446    2.152471 -2.3039752 8.993339e-05 0.1656600
USP6NL    5.988866    7.058738  1.0698718 9.648226e-05 0.1656600
COMMD4    4.157971    3.407405 -0.7505660 2.454557e-04 0.2836153
其实这个操作在DESeq2差异分析包里都可以一个函数搞定的。之前用过但是不明白怎么来的。
19 使用limma包对表达矩阵及样本分组信息进行差异分析,得到差异分析表格,重点看logFC和P值,画个火山图(就是logFC和-log10(P值)的散点图。)。
这个题目就是用limma包的函数直接完成类似上面的操作
library(limma)
# 这是一个设计矩阵的参数类似函数
design1=model.matrix(~factor(group_list))
#命名/赋予名称
colnames(design1)=levels(factor(group_list))
rownames(design1)=colnames(exprset)
#校验函数
fit1 = lmFit(exprset,design1)
fit1=eBayes(fit1)
#设置结果的小数位数为3
options(digits = 3)
#coef要么必须等于2, 要么是个字符串;关于adjust的设置,说明书中13.1章有描述,BH是最流行的设置
mtx1 = topTable(fit1,coef=2,adjust='BH',n=Inf)
# topTable 默认显示前10个基因的统计数据;使用选项n可以设置,n=Inf就是不设上限,全部输出
#去除缺失值
DEG_mtx1 = na.omit(mtx1)
#输出前6行
head(DEG_mtx1)
输出结果如下:
> head(DEG_mtx1)
         ID  logFC AveExpr     t  P.Value adj.P.Val    B
4027  CLIC1 -0.989    9.95 -5.77 9.62e-06    0.0444 3.19
2279  DLEU1 -1.830    6.95 -5.74 1.03e-05    0.0444 3.13
4662  GPM6A -2.547    6.92 -5.04 5.29e-05    0.1134 1.79
7944 YTHDC2  0.519    7.60  4.87 7.95e-05    0.1134 1.45
4025  SGSM2  0.916    8.21  4.86 8.17e-05    0.1134 1.43
1477   TSC1  0.854    5.75  4.86 8.18e-05    0.1134 1.43
- 解释一下代码:
design1=model.matrix(~factor(group_list))这是一个设计矩阵,关于设计矩阵的一些知识,可以看这篇笔记《线性模型》。
这是前人总结的内容,具体涉及的数学的内容我也不太明白。
但是这里面用的2个函数很重要,值得记下来
lmFit函数是用于构建一个线性模型;它的参数一个是表达矩阵,一个是分组对象
eBays函数是用于构建一个微阵列线性模型。
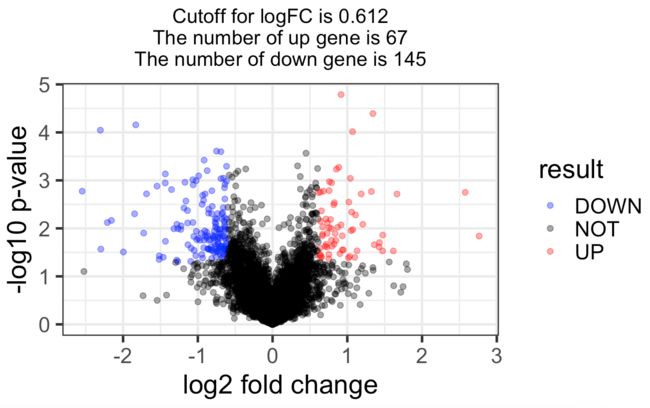
library(ggplot2)
DEG=DEG_mtx1
logFC_cutoff <- with(DEG,mean(abs(logFC)) + 2*sd(abs(logFC)) )
DEG$result = as.factor(ifelse(DEG$P.Value < 0.05 & abs(DEG$logFC) > logFC_cutoff,
                              ifelse(DEG$logFC > logFC_cutoff ,'UP','DOWN'),'NOT'))
this_tile <- paste0('Cutoff for logFC is ',round(logFC_cutoff,3), #round保留小数位数
                    '\nThe number of up gene is ',nrow(DEG[DEG$result =='UP',]) ,
                    '\nThe number of down gene is ',nrow(DEG[DEG$result =='DOWN',])
)
ggplot(data=DEG, aes(x=logFC, y=-log10(P.Value), color=result)) +
  geom_point(alpha=0.4, size=1.75) +
  theme_set(theme_set(theme_bw(base_size=20)))+
  xlab("log2 fold change") + ylab("-log10 p-value") +
  ggtitle( this_tile ) + theme(plot.title = element_text(size=15,hjust = 0.5))+
  scale_colour_manual(values = c('blue','black','red'))

DEG=DEG_t.test
logFC_cutoff <- with(DEG,mean(abs(log2FC )) + 2*sd(abs(log2FC)) )
DEG$result = as.factor(ifelse(DEG$pvals < 0.05 & abs(DEG$log2FC) > logFC_cutoff,
                              ifelse(DEG$log2FC > logFC_cutoff ,'UP','DOWN'),'NOT'))
this_tile <- paste0('Cutoff for logFC is ',round(logFC_cutoff,3), #round保留小数位数
                    '\nThe number of up gene is ',nrow(DEG[DEG$result =='UP',]) ,
                    '\nThe number of down gene is ',nrow(DEG[DEG$result =='DOWN',])
)
ggplot(data=DEG, aes(x=log2FC, y=-log10(pvals), color=result)) +
  geom_point(alpha=0.4, size=1.75) +
  theme_set(theme_set(theme_bw(base_size=20)))+
  xlab("log2 fold change") + ylab("-log10 p-value") +
  ggtitle( this_tile ) + theme(plot.title = element_text(size=15,hjust = 0.5))+
  scale_colour_manual(values = c('blue','black','red'))
结果差异下调的更明显。t-test的下调比limma的少了20个,上调的少了12个基因。
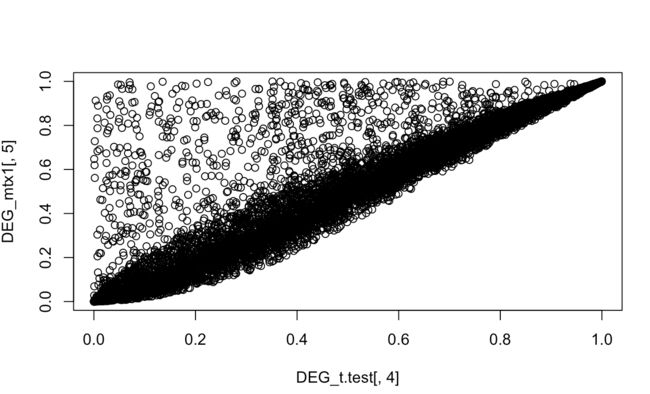
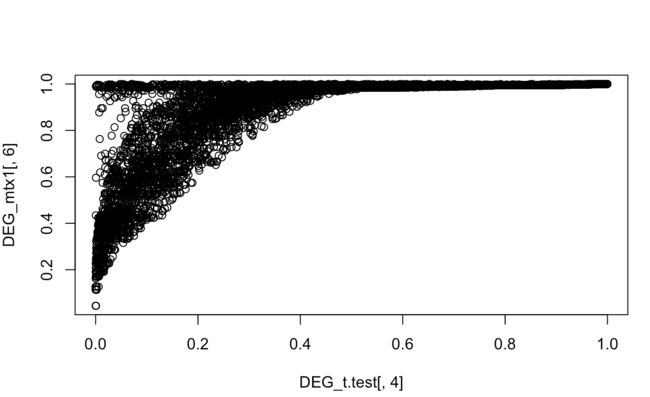
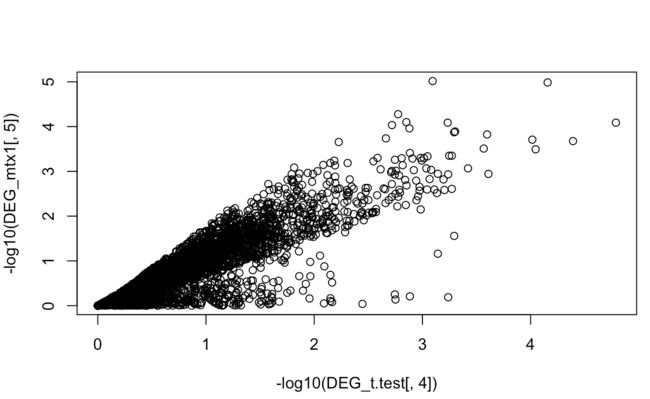
20 对T检验结果的P值和limma包差异分析的P值画散点图,看看哪些基因相差很大。
#20 different P values
head(DEG_mtx1)
head(DEG_t.test)

DEG_t.test=DEG_t.test[DEG_mtx1[,1],]
plot(DEG_t.test[,4],DEG_mtx1[,5])
plot(DEG_t.test[,4],DEG_mtx1[,6])
plot(-log10(DEG_t.test[,4]),-log10(DEG_mtx1[,5]))
这个周末都耗在这20个题目上了。但是巩固了好多基础知识。
设计者真是用心良苦。
再此感谢前辈们的无私分享!


